
Introduction
Learning objectives: You will learn about national reference data. This section also covers data on aspects of individual and population circumstances that may affect the wider determinants of health, including socio-economic, lifestyle, and environmental data. Please read the resource text below.
Resource text
Circumstantial data This covers data on aspects of individuals' and populations' circumstances that may affect the wider determinants of health, including socio-economic, lifestyle, and environmental data. Figure 1: This diagram (from Dahlgren & Whitehead 1992) is a useful way of illustrating circumstantial data. 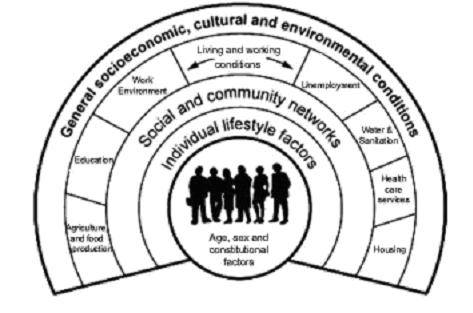 Education data Information on educational attainment data, where it can be sourced from and its relevance to inequalities in health can be found in section 3 of this link. Employment data Information on employment data, where it can be sourced from and its relevance to inequalities in health can be found in section 1 of this link. Housing data Information on housing and homelessness, where it can be sourced from and its relevance to inequalities in health can be found in section 2 of this link. Environment data Information on air quality can be found at this link. Statistics on air quality can be found in section 5 of this link. References H Brenner, C Stegmaier, and H Ziegler, Estimating completeness of cancer registration: an empirical evaluation of the two source capture-recapture approach in Germany J Epidemiol Community Health 1995; 49: 426-430. National reference data This covers data not purely issued for health purposes, but which are used in connection with health data to improve understanding of health issues. Examples are given below. Deprivation data Exploring health differences between population groups may require analysing information by age, ethnicity, gender, or by social and economic circumstances[1]. Poverty is an important determinant of health, and increasing inequalities in health are examined through analyses based on measures of social and material deprivation, rather than, for example, occupation. A variety of indicators have been developed, which differ according to different concepts of deprivation under consideration. The underlying concepts of deprivation are complex, and care must be taken when using the scores; the indices are indirect indicators rather than direct measures. Deprivation scores a. Index of multiple deprivation Index of multiple deprivation (ID2000, ID 2004 and most recently ID2007). Originally developed by the Office of the Deputy Prime Minister and now overseen by the Department for Communities and Local Government, this index is not census based, but made up from routine data sources, such as data on benefit recipients, hospital emergency admissions, educational attainment, local authority homelessness figures, crime statistics and road traffic injuries. It comprises seven domains which relate to income, employment, health, disability, education skills and training, barriers to housing and services, living environment and crime. The revised index from 2004 (ID2004 and ID2007) assigns a deprivation score to each super output area (lower SOA) and local authority in England[5] (lower SOAs are made up of groups of output areas, and ID2004 and ID2007 use census data to estimate population denominators). Now that a consistent approach has been used ID2004 and ID2007 can be directly compared. Ranks of income score and employment score are available separately, in addition to an average score. Other related indices can be developed/derived such as the Child Poverty Index. See also Indices of Deprivation: 2007. b. Jarman Score [2][3] The Jarman score was developed as a measure of General Practice workload in the mid-eighties. It used responses from GPs about their workload, and combined this information with eight census variables into a single deprivation index. It was originally designed to measure need for primary care and has sometimes been used as a proxy for deprivation. It has been used by the Department of Health to determine additional 'deprivation' payments to GPs. The variables used include:
- 1. % elderly living alone 2. % children under five 3. % unskilled workers 4. % overcrowded households 5. % changed address in last year 6. % residents living in a household where the head was born in the New Commonwealth or Pakistan 7. % unemployed 8. % households containing lone parents
A positive score equates with deprivation. The mean for England and Wales is 0. An area with a high score has a greater demand for primary care, based on the characteristics of the resident population, than an area with a low score. Extreme scores are those above 32 (rounded to 30 by the Department of Health). Example South Gloucestershire has a Jarman score of -21.38 meaning that it has a lower demand for primary care than England and Wales mean, but Bristol UA has a score of 17.85, higher than the England and Wales mean. Pros
- can be used for small areas
- a diverse range of measurements make up the score
Cons
- differences within wards are often masked, as there can be great variation of deprivation within a particular ward.
- the data is 10 years out of date.
- it does not indicate the proportion of people in an area that are deprived.
- it is biased toward the urban population.
c. Townsend Material Deprivation Score [4] The Townsend score is made up by looking at four variables:
- 1. unemployment - % of economically active residents aged 16-59/64 who are unemployed; 2. car ownership - % of private households who do not possess a car; 3. owner occupation - % of households not owner occupied; 4. overcrowding (over 1 person per room) - % of private households with more than 1 person per room.
The data are taken from the census. The variables combine to form an overall score ranking a particular area relative to others. The higher the score, the more deprived the area. The average is 0. The scores can only be used to rank areas. This is because the actual score has no value, i.e. an area with a score of 4 is not twice as deprived as an area with a score of 2. Example Based on Avon standardisation, the most affluent area in Avon has a score of -9.0, the most deprived has a score of 9. Pros
- it can be used to look at small areas.
- highly correlated with measures of ill health, e.g. SMRs or limiting long-term illness.
- as it is the sum of standardised scores, it is easy to calculate.
Cons
- the data can be 10 years out of date.
- it does not indicate the proportion of people in an area that are deprived.
- it is a better indicator of deprivation of urban areas than rural areas.
- lack of car ownership in London, for example, may well not correlate with low income.
Mental health needs index The Mental Health Needs Index (MINI) provides an estimate of the need for inpatient mental health services for adults (ages 16-59) by ward and borough. It is calculated using a number of population variables likely to indicate need for access to services, such as deprivation, proportion of economically active adults unemployed, proportion of adults living in households not self contained etc. The MINI provides both predicted admission rates and a ratio of need compared to the England average. The MINI was developed by the Centre for Public Mental Health, which has produced an online tool for accessing information on a ward/borough level. Health poverty index The Health Poverty Index (HPI) tool allows groups, differentiated by geography and cultural identity, to be contrasted in terms of their 'health poverty'. A group's health poverty' is a combination of both its present state of health and its future health potential or lack of it. Gini coefficient This is a widely used summary measure of inequality in household income and was invented by Corrado Gini . It represents an overall measure of the cumulative income share against the share of households in the population. The lower the value of the Gini coefficient, the more equally household income is distributed. The Gini coefficient is used to show the degree of income inequality between different groups of households in the population. It can also be used to show how inequality of incomes has been changing over a period of time. The Gini coefficient is the area between the Lorenz curve and the line of equality and its value lies between 0 and 1. It can be used to rank countries. The index for the entire world has been estimated to be between 56 and 66. An example of the use of GINI coefficients to investigate the effect of private sector data on inequality of revascularisation admissions across London can be found at the London Health Observatory. References
- [1] Donaldson L.J., Donaldson R.J Essential Public Health (2nd Edition, revised) Petroc Press 2003 [2] Measuring inequality of household income: the Gini coefficient