
Introduction
Learning objectives:
You will learn about commonly used epidemiological measurements to describe the occurrence of disease. This section covers:
Measures of disease frequency including:
a) Prevalence
b) Incidence
c) Calculation of person-time at risk
d) Issues in defining the population at risk
e) The relationships between incidence and prevalence
f) Commonly used measures of disease frequency
Measures of effect including:
g) Main measures of effect
h) Interpreting measures of effect
The essence of epidemiology is to measure disease occurrence and make comparisons between population groups. The current section introduces the commonly used measures that help our understanding of the distribution of disease in a given population.
Please now read the resource text below.
Resource text
A principal role of epidemiology is to describe and explain differences in the distribution of disease or other health outcomes of interest between populations.
Examples of health outcomes measured in epidemiological studies include:
1. Morbidity
2. Mortality
3. Infectious disease incidence
4. Birth defects
5. Disability
6. Injuries
7. Vaccine efficacy
8. Utilization of hospital services
Measures of disease frequency are used to describe how common an illness (or other health event) is with reference to the size of the population (the population at risk) and a measure of time.
There are two main measures of disease frequency:
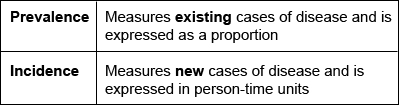
1. Prevalence
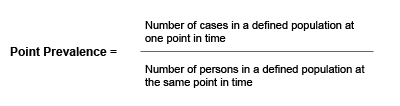
Prevalence measures the proportion of individuals in a defined population that have a disease or other health outcomes of interest at a specified point in time (point prevalence) or during a specified period of time (period prevalence).
Example
Of 10,000 female residents in town A on 1st January 2006, 1,000 have hypertension.
The prevalence of hypertension among women in town A on this date is calculated as:
1,000/10,000 = 0.1 or 10%
- Prevalence is a useful measure for quantifying the burden of disease in a population at a given point in time
- Calculating prevalence of various conditions across different geographical areas or amongst different sub-groups of the population and then examining prevalence of other potential risk factors can be of particular use when planning health services
- Prevalence is not a useful measure for establishing the determinants of disease in a population
2. Incidence
In contrast to prevalence, incidence is a measure of the number of new cases of a disease (or other health outcome of interest) that develops in a population at risk during a specified time period.
There are two main measures of incidence:
| Risk (or cumulative incidence) | Is related to the population at risk at the beginning of the study period |
| Rate | Is related to a more precise measure of the population at risk during the study period and is measured in person-time units. |
Risk
Risk is the proportion of individuals in a population (initially free of disease) who develop the disease within a specified time interval. Incidence risk is expressed as a percentage (or if small as per 1000 persons).
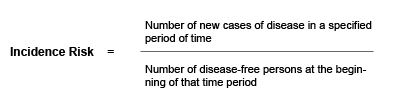
The incidence risk assumes that the entire population at risk at the beginning of the study period has been followed for the specified time period for the development of the outcome under investigation. However, in a cohort study participants may be lost during follow-up.
For example, some participants may:
- Develop the outcome under investigation
Refuse to continue to participate in the study
Migrate
Die
Enter the study some time after it starts
To account for these variations during follow up, a more precise measure can be calculated, the incidence rate .
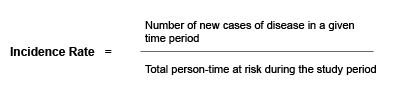
Incidence Rate
Incidence rates also measure the frequency of new cases of disease in a population. However, incidence rates take into account the sum of the time that each person remained under observation and at risk of developing the outcome under investigation.
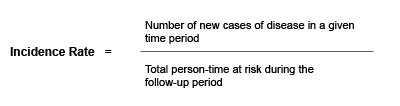
3. Calculation of person-time at risk
The denominator in an incidence rate is the sum of each individual's time at risk and is commonly expressed in person years at risk.
The incidence rate is the rate of contracting the disease among those still at risk. When a study subject develops the disease, dies or leaves the study they are no longer at risk and will no longer contribute person-time units at risk.
Figure 1: Person-time at risk
Person-time at risk is a measure of the number of persons at risk during the given time-period. In the graph below, different numbers of persons are at risk (N-d) during the time-period t. The total person-time at risk is represented by the area below the line (Y). Persons who have developed the disease (d) are no longer considered at risk (as they already have the disease).
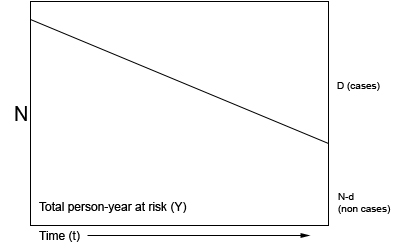
N = population initially at risk, Y = person years at risk, D = number of new cases, incidence rate = d/Y, risk (cumulative incidence) = d/N
For example:
Figure 2: Person-time (years) at risk for 5 individuals in a hypothetical cohort study between 2000-2004.
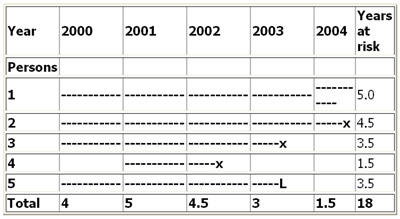
--- = time at risk, X = disease, L = person lost to follow up
Figure 2 illustrates the calculation of person-time units (years) at risk of a hypothetical population of 5 individuals in a 5 year cohort study. In the above example the incidence rate for disease (X) is calculated as:
3/18 = 0.167 per person year or 16.7 per 100 person years.
Note that for most rare diseases, risks and rates are numerically similar because the number at risk will approximately equal the total population at all times.
4. Issues in defining the population at risk
- For any measure of disease frequency, precise definition of the denominator is essential for accuracy and clarity [1]
- The population at risk (denominator) should include all persons at risk of developing the outcome under investigation. Therefore, individuals who currently have the disease under study or who are immune (e.g. due to immunization) should be excluded from the denominator. However, this is not always possible in practice [1]
- Note that when individuals not at risk of the disease are included in the denominator (population at risk) the resultant measure of disease frequency will underestimate the true incidence of disease in the population under investigation
5. The relationship between prevalence and incidence
The proportion of the population that has a disease at a point in time (prevalence) and the rate of occurrence of new disease during a period of time (incidence) are closely related [1].
Prevalence depends on:
1. The incidence rate (r)
2. The duration of disease (T)
For example, if the incidence of a disease is low but the duration of disease (i.e. until recovery or death) is long, the prevalence will be high relative to the incidence. For example diseases like leprosy or tuberculosis tend to persist for a longer duration, from months to years, hence the prevalence (old and new cases) would be longer than the incidence.
Conversely, if the incidence of a disease is high and the duration of the disease is short, the prevalence will be low relative to the incidence [1]. For example, acute conditions like diarrhoea have a relatively short duration (a few days).
A change in the duration of a disease, for example the development of a new treatment which prevents death but does not result in a cure will lead to an increase in prevalence. Fatal diseases or diseases from which a rapid recovery is common have a low prevalence, whereas diseases with a low incidence may have a high prevalence if they are incurable but rarely fatal and have a long duration.
The relationship between incidence and prevalence can be expressed as:
P = ID
P = Prevalence
I = Incidence Rate
D = Average duration of the disease
A population in which the numbers of people with and without the disease remain stable is known as a steady-state population. In such (theoretical) circumstances, the point prevalence of disease is approximately equal to the product of the incidence rate and the mean duration of disease (i.e. length of time from diagnosis to recovery or death), providing that prevalence is less than about 0.11.
That is Prevalence = Incidence x Duration
As a result, when two of the measures are known, the third can be calculated by substitution.
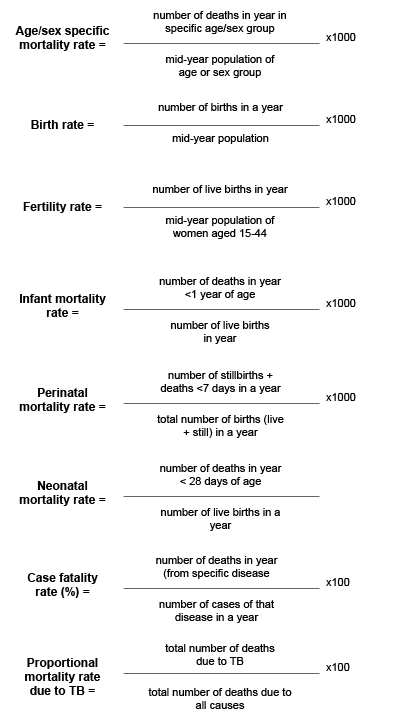
6. Other commonly used measures of disease frequency in epidemiology
Measures of effect
Measures of effect are used in epidemiological studies to assess the strength of an association between a putative risk factor and the subsequent occurrence of disease. This requires that the incidence of disease in a group of persons exposed to a potential risk factor is compared with the incidence in a group of persons not exposed to the potential risk factor.
This comparison can be summarized by calculating either the ratio of measures of disease frequency for the two groups or the difference between the two, and reflects the increase in frequency of disease in one population compared with another, treated as baseline.
These measures are often collectively referred to as measures of relative risk
The relative risk is a measure of the strength of an association between an exposure and disease and can be used to assess whether a valid observed association is likely to be causal [1].
The most commonly used measure of effect is the ratio of incidence rates that is:
Rate (or risk) in exposed group
Rate (or risk) in unexposed group
7. Three main measures of effect
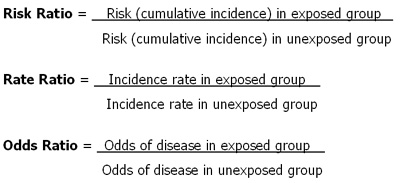
Example: There are 10 times more lung cancers in smokers than in non smokers (Rate Ratio = 10)
8. Interpreting measures of relative risk (RR)
A relative risk of 1.0 - indicates that the incidence of disease in the exposed and unexposed groups is identical and that there is no association observed between the disease and risk factor/exposure.
A relative risk > 1.0 occurs when the risk of disease is greater among those exposed and indicates a positive association, or an increased risk among those exposed to the risk factor compared with those unexposed. A relative risk of 1.3 means a 30% rise in risk for those exposed to the risk factor compared to those who were unexposed.
A relative risk < 1.0 occurs when the risk of disease is lower among those exposed and indicates an inverse association or decreased risk among those exposed. A relative risk of 0.8 means a 20% decrease in risk for those exposed to the risk factor compared to those who were unexposed.
Note: Rate ratios and risk ratios tend to be numerically similar for rare diseases.
The choice of a ratio measure or a difference measure should be based on our understanding of the mechanism by which a risk factor increases the incidence of disease
References
1. Hennekens CH, Buring JE. Epidemiology in Medicine, Lippincott Williams & Wilkins, 1987.