Parametric and Non-parametric tests for comparing two or more groups
Statistics: Parametric and non-parametric tests
This section covers:
- Choosing a test
- Parametric tests
- Non-parametric tests
Choosing a Test
In terms of selecting a statistical test, the most important question is "what is the main study hypothesis?" In some cases there is no hypothesis; the investigator just wants to "see what is there". For example, in a prevalence study there is no hypothesis to test, and the size of the study is determined by how accurately the investigator wants to determine the prevalence. If there is no hypothesis, then there is no statistical test. It is important to decide a priori which hypotheses are confirmatory (that is, are testing some presupposed relationship), and which are exploratory (are suggested by the data). No single study can support a whole series of hypotheses. A sensible plan is to limit severely the number of confirmatory hypotheses. Although it is valid to use statistical tests on hypotheses suggested by the data, the P values should be used only as guidelines, and the results treated as tentative until confirmed by subsequent studies. A useful guide is to use a Bonferroni correction, which states simply that if one is testing n independent hypotheses, one should use a significance level of 0.05/n. Thus if there were two independent hypotheses a result would be declared significant only if P<0.025. Note that, since tests are rarely independent, this is a very conservative procedure – i.e. one that is unlikely to reject the null hypothesis. The investigator should then ask "are the data independent?" This can be difficult to decide but as a rule of thumb results on the same individual, or from matched individuals, are not independent. Thus results from a crossover trial, or from a case-control study in which the controls were matched to the cases by age, sex and social class, are not independent.
- Analysis should reflect the design, and so a matched design should be followed by a matched analysis.
- Results measured over time require special care. One of the most common mistakes in statistical analysis is to treat correlated variables as if they were
independent. For example, suppose we were looking at treatment of leg ulcers, in which some people had an ulcer on each leg. We might have 20 subjects with
30 ulcers but the number of independent pieces of information is 20 because the state of ulcers on each leg for one person may be influenced by the state of
health of the person and an analysis that considered ulcers as independent observations would be incorrect. For a correct analysis of mixed paired and unpaired
data consult a statistician.
The next question is "what types of data are being measured?" The test used should be determined by the data. The choice of test for matched or paired data is described in Table 1 and for independent data in Table 2.
Table 1 Choice of statistical test from paired or matched observation
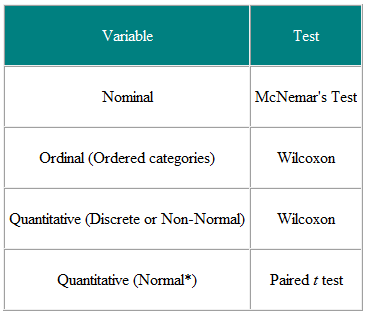
It is helpful to decide the input variables and the outcome variables. For example, in a clinical trial the input variable is the type of treatment - a nominal variable - and the outcome may be some clinical measure perhaps Normally distributed. The required test is then the t-test (Table 2). However, if the input variable is continuous, say a clinical score, and the outcome is nominal, say cured or not cured, logistic regression is the required analysis. A t-test in this case may help but would not give us what we require, namely the probability of a cure for a given value of the clinical score. As another example, suppose we have a cross-sectional study in which we ask a random sample of people whether they think their general practitioner is doing a good job, on a five point scale, and we wish to ascertain whether women have a higher opinion of general practitioners than men have. The input variable is gender, which is nominal. The outcome variable is the five point ordinal scale. Each person's opinion is independent of the others, so we have independent data. From Table 2 we should use a χ2 test for trend, or a Mann-Whitney U test with a correction for ties (N.B. a tie occurs where two or more values are the same, so there is no strictly increasing order of ranks – where this happens, one can average the ranks for tied values). Note, however, if some people share a general practitioner and others do not, then the data are not independent and a more sophisticated analysis is called for. Note that these tables should be considered as guides only, and each case should be considered on its merits.
Table 2 Choice of statistical test for independent observations
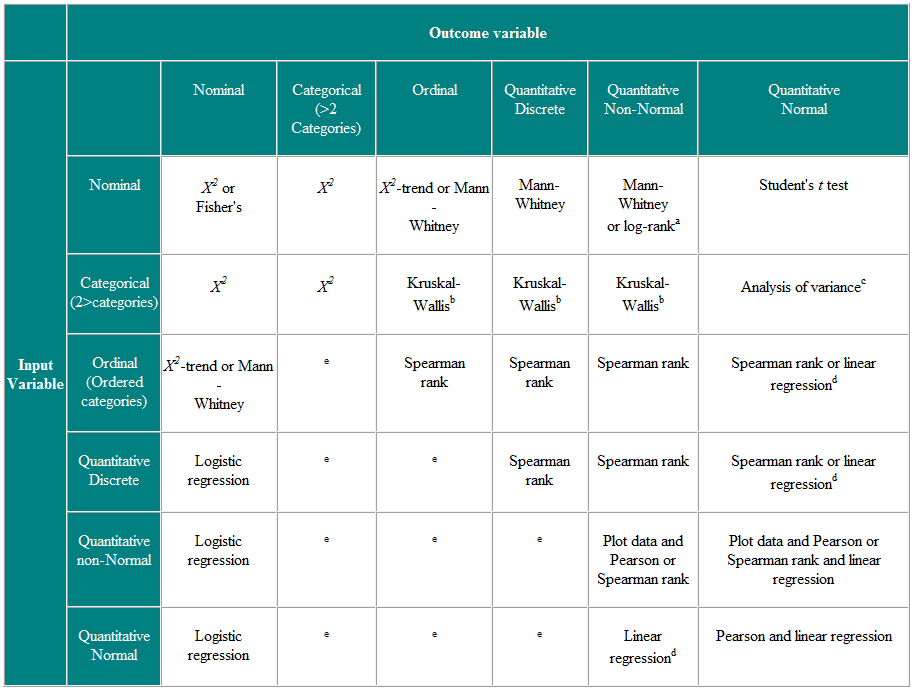
a If data are censored. b The Kruskal-Wallis test is used for comparing ordinal or non-Normal variables for more than two groups, and is a generalisation of the Mann-Whitney U test. c Analysis of variance is a general technique, and one version (one way analysis of variance) is used to compare Normally distributed variables for more than two groups, and is the parametric equivalent of the Kruskal-Wallistest. d If the outcome variable is the dependent variable, then provided the residuals (the differences between the observed values and the predicted responses from regression) are plausibly Normally distributed, then the distribution of the independent variable is not important. e There are a number of more advanced techniques, such as Poisson regression, for dealing with these situations. However, they require certain assumptions and it is often easier to either dichotomise the outcome variable or treat it as continuous.
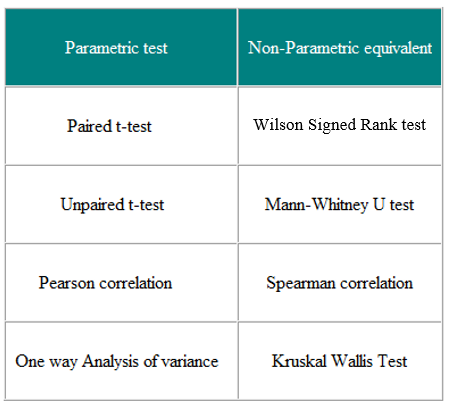
Parametric tests are those that make assumptions about the parameters of the population distribution from which the sample is drawn. This is often the assumption that the population data are normally distributed. Non-parametric tests are “distribution-free” and, as such, can be used for non-Normal variables. Table 3 shows the non-parametric equivalent of a number of parametric tests.
Table 3 Parametric and Non-parametric tests for comparing two or more groups
Non-parametric tests are valid for both non-Normally distributed data and Normally distributed data, so why not use them all the time?
It would seem prudent to use non-parametric tests in all cases, which would save one the bother of testing for Normality. Parametric tests are preferred, however, for the following reasons:
1. We are rarely interested in a significance test alone; we would like to say something about the population from which the samples came, and this is best done with
estimates of parameters and confidence intervals.
2. It is difficult to do flexible modelling with non-parametric tests, for example allowing for confounding factors using multiple regression.
3. Parametric tests usually have more statistical power than their non-parametric equivalents. In other words, one is more likely to detect significant differences when
they truly exist.
Do non-parametric tests compare medians?
It is a commonly held belief that a Mann-Whitney U test is in fact a test for differences in medians. However, two groups could have the same median and yet have a significant Mann-Whitney U test. Consider the following data for two groups, each with 100 observations. Group 1: 98 (0), 1, 2; Group 2: 51 (0), 1, 48 (2). The median in both cases is 0, but from the Mann-Whitney test P<0.0001. Only if we are prepared to make the additional assumption that the difference in the two groups is simply a shift in location (that is, the distribution of the data in one group is simply shifted by a fixed amount from the other) can we say that the test is a test of the difference in medians. However, if the groups have the same distribution, then a shift in location will move medians and means by the same amount and so the difference in medians is the same as the difference in means. Thus the Mann-Whitney U test is also a test for the difference in means. How is the Mann- Whitney U test related to the t-test? If one were to input the ranks of the data rather than the data themselves into a two sample t-test program, the P value obtained would be very close to that produced by a Mann-Whitney U test.
Reference
- Campbell MJ and Swinscow TDV. Statistics at Square One 11th ed. Wiley-Blackwell: BMJ Books 2009.
© MJ Campbell 2016, S Shantikumar 2016