
PLEASE NOTE:
We are currently in the process of updating this chapter and we appreciate your patience whilst this is being completed.
In statistics, the term bias is used for describing several different concepts, which have in common the tendency to distort experiments, observations, or tests in a systematic way. In its most basic sense, a biased sample is one in which some members of the population are more likely to be included than others. In some cases, such as polls organised by newspapers and magazines, the sampling frame comprises the readers of the particular publication, who are likely to make up a highly biased selection according to the degree they reflect the interests, attitudes, sociological, gender, and ethnic approaches of the publication. These should never be taken as representative of the population as a whole.
Forms of bias frequently encountered include:
1. Participation Bias
Also known as Response Bias, Participation bias arises where there are systematic differences between those in a population who are invited to participate in a study and agree and those who refuse to do so. The result causes the participating population to differ from the whole population. Typical examples are in:
- sexual health surveys, where non-respondents tend to be older, more church-going, have less liberal social attitudes, and be more likely to smoke tobacco or drink alcohol
http://findarticles.com/p/articles [accessed 16/08/2018]
- childhood immunisation studies, where followers of the philosophy of Rudolph Steiner may decline to take part in sufficient numbers to affect a local study, or certain sections of the community may have been convinced by newspaper coverage that immunisation may introduce unnecessary risks to children. After 1998, MMR vaccination rates went down in the UK after the publicity surrounding the publication of a very poor, and indeed reported as fraudulent, paper in the Lancet, which mentioned a purported link between the MMR vaccine and colitis and autism spectrum disorders.
https://en.wikipedia.org/wiki/MMR_vaccine_controversy [accessed 16/08/2018]
It is rarely, if ever, that we get a complete count and collection of all relevant data for a whole population. Even the Census, which purports to be the gold standard for the population, can be seriously affect by participation bias. In the middle to late 1990s following a period during which a controversial 'poll tax' had been introduced in the UK, large numbers of young men set about attempting to become invisible to the poll tax register, in order to avoid having to pay the tax. Among other issues, they dropped off electoral rolls. Population estimates were produced by the Office of National Statistics (then OPCS), but when the results of the 2001 Census were known there were about a million fewer men of younger working age counted than had been estimated and the published population estimates were modified using data from the 1991 Census.
Note that if non-participants are found randomly across the population they do not contribute to bias.
2. Selection Bias
Selection bias refers to the possibility of participants in a study being allocated to an arm according to (generally subconscious) expectations of the allocator. For example, in a cancer trial a physician might have a feeling towards a particular intervention for particular patients. This can be avoided by careful use of random allocation, using tables of random numbers or computerised systems, to allocate patients to possible trial arms without the person entering them into the trial knowing which the allocated treatment is (called ‘masking’ or ‘blinding’ though this latter term is understandably not used in ophthalmology journals!). Ideally, the person delivering the intervention should also be unaware of which intervention is made (e.g., by having placebo pills made to look identical to the tested therapy). Where the detail is hidden from both allocator and therapist the technique is known as 'double blinding' or 'double masking', and is obviously impossible in some cases (e.g. surgery). Where the trial's statistical analyst is also unaware of which arm was the trial arm it is known as 'triple blinding', which is considered the purest form of design to avoid selection bias.
3. Length / Length-time Bias
Where there is a screening programme in place for a population this will be because the screening test had been shown to provide early detection of a condition which is susceptible to intervention in the early stages (for details of screening tests see the Diagnosis and Screening module).
This means that substantial numbers of cases of the condition are picked up by the screening programme at a point where they may be pre-symptomatic. If a survival analysis is done comparing diagnosis to death distributions of screened and unscreened groups, analysis is likely to show a major advantage to the screened population. However these are diagnosed earlier, and more data and more sophisticated analysis, is required to determine whether the screening has genuine clinical benefit (e.g. if the screened and unscreened arms are samples drawn from the same underlying population and the screened population died at a noticeably greater average age than the unscreened the effect is likely to be genuine, while if they tend to die at the same age there is probably no benefit from the screening programme.
4. Publication Bias
This arises for one of two reasons.
- Researchers, sponsors, and journal editors are naturally far more interested in reporting experiments that produce a positive result than those that do not. Inevitably, where trials are limited in size and compare controlled arms to reject the null hypothesis, many trials cannot reject the null hypothesis at the standard levels of probability. Whilst these are generally written up in the normal way for local use, few are developed into academic papers for learned journals by which they would go into the general knowledge base. Papers which say X has no effect are unlikely to be read widely as they will not lead to changes in practice (except for those who already use X), whereas positive results do lead to changes in clinical practice. Hence a strong publication bias in favour of positive results.
- Research is expensive to carry out, there is little in the way of government or uninterested funding (except for certain high-profile charities, which may have their own research agendas) and the bodies most interested in obtaining trial research results are the pharmaceutical companies which develop the treatments and fund most of the research into the products. Studies have shown that trials funded by manufacturers are much more likely to be favourable to the manufacturer's product than independently funded studies. It is now normal for research publications to included details of funding and any conflict of interest the researchers may recognise with published research papers.
http://www.bmj.com [both accessed 16/08/2018]
A useful tool for investigating publication bias is the Funnel Plot:
http://en.wikipedia.org/wiki/Funnel_plot [accessed 16/08/2018] which graphically compares study sizes with effect sizes. When publication bias is absent the plot tends to be symmetrical about its midline, whilst when it publication bias is present studies cluster on one side of the midline.
Artifacts
Claud Shannnon's Information Theory https://en.wikipedia.org/wiki/Information_theory suggests that it is impossible to measure an effect without altering the system measured: any measurement involves a transfer of energy into and/or out of the measured system. In physics and signal processing, an artifact is any perceived distortion or other data error caused by the instrument of observation. In organisational and sociological terms, this is often referred to as the Hawthorne Effect, after a factory near Chicago where experiments in productivity were carried out 1924-32. It may be summarised as 'people behave differently when they are being watched'. That is to say, at least some part of what is observed is an artifact of the process of observation. For example, the ‘placebo effect’ (or ‘therapeutic effect’), might be partly considered an artifact due to people being aware they are in a clinical trial.
In social and public health terms, we often have to use concepts that derive entirely from instruments of observation, with results that are highly artifactual. Any individual with a fixed abode (and therefore a postcode in the UK) will be linked to various physical and administrative geographies at which social and health-related concepts are calculated and presented. The Indicators of Multiple Deprivation are issued at Super Output Area level; census data are published at Output Area Level; life expectancy is likely to be calculated at local authority ward level, at LA or CCG level. Without borders we could not talk about, describe or analyse, but each choice of border creates its own artifacts.
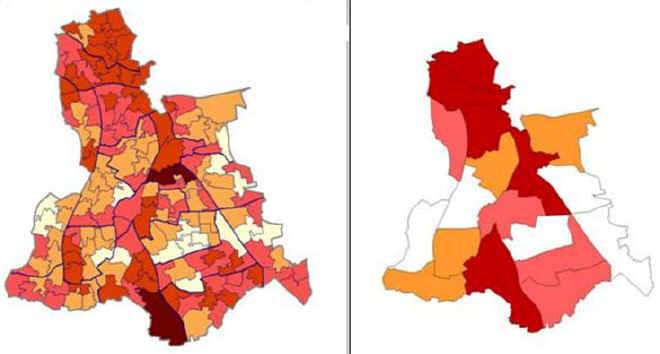
The two maps below show the Index of Multiple Deprivation (IMD) 2004 for the London Borough of Lewisham at, firstly, Lower Super Output Level (SOA), and secondly at electoral ward level. Neither is 'wrong'. The SOA map shows a higher level of variation and granularity; the ward map can be linked to services provided, and is more easily interpreted by local councillor. The maps, and the differences between them, are artifacts of the level of description chosen.
In 2003-5, male life expectancy at birth was about 76.5 years for those born in England, and very similar for the London-born. A male born in LB Lewisham during the same period had a life-expectancy of 75. One born in the electoral ward of New Cross had a life expectancy of only 70. Again, the choice of unit to measure affects the quantity measured.
It has been suggested, given the artifactual nature of the methods, that the entire spectrum of sociological vocabulary may describe only artifacts, with nothing of substance to underpin it. Such claims have been made for the possible explanations of health inequalities in the Black Report (1980) https://en.wikipedia.org/wiki/Black_Report [accessed 16/08/2018]: that the association between social class and health is purely an artefact of the way these concepts are measured. This argument is undermined by the fact that inequalities have been demonstrated using a number of different systems of measurement of social class. Nonetheless, public health practitioners need to take care in creating and choosing instruments for measurement and analysis, and to be consciously aware of potential artefactual consequences.
© M Goodyear 2008, D Lawrence 2018