
Sometimes we are interested in an event which might occur at any time over a lengthy period of follow-up. In these cases we are often interested in how long it takes for the event to occur as well as what proportion experienced it. A set of special techniques known collectively as survival analysis is used to analyse this sort of data.
The summary statistic is called the hazard ratio (HR), which can be interpreted in a similar way to the relative risk, although it is actually comparing the area under the survival curves rather than the risk of the event. It is much more powerful than RR or OR for this sort of data and, importantly, does not require a timepoint to be specified for the analysis. The RR and OR might vary dramatically depending on the timepoint (eg one year after randomisation vs 5 years after randomisation), whereas the HR takes into account all of the information available.
A survival analysis should usually be accompanied by Kaplan-Meier survival curves, a special plot based on similar methods to those used to calculate the HR. This allows a visual assessment of the pattern of survival over time, something which is impossible to capture in a single summary statistic. The survival curves can be used to estimate the proportions surviving at any given timepoint and the median survival in each group.
The following plot show the results for recurrence-free survival in the ICON1 & ACTION trials, a prospective meta-analysis of two trials of adjuvant chemotherapy for early ovarian cancer.
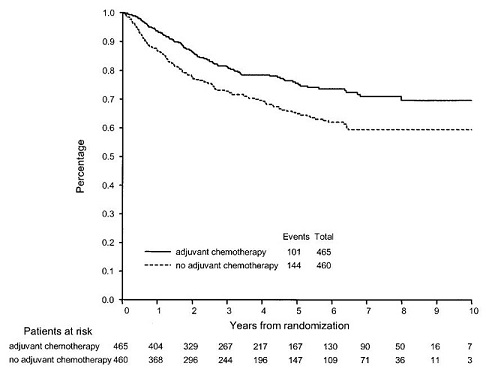
The clearly separated curves suggest that adjuvant platinum-based chemotherapy following surgery in early stage ovarian cancer is beneficial in terms of overall survival. The HR was 0.64.
Trials with smaller sample sizes will often have jerky looking Kaplan-Meier curves, with large "steps" in the lines because the events observed are few and far between. The greater the number of events, and the number still alive and at risk, the more reliable the curves will be. Most curves will become unreliable towards the end, as more participants will have died and more lost to follow-up.
Click the "up" link below to return to the index page of the Outcome Measures section, or click here to move on to Statistical Significance...