
Introduction
 Learning objectives: You will learn about the three types of biases, including response, selection and publication bias, and also the concept of artefacts as they impact on interpretation of health information and analysis.
This section covers the types of bias that might exist and outlines specific examples of bias that healthcare professionals need to be aware of and take into account when considering accessing data, interpreting outcomes, and using health information to inform everyday decisions.
Read the resource text below which covers biases in population data.
Resource text
In statistics, bias can be defined as a systematic error which results in a variation or deviation from the true value or outcome of an experiment, test or observation. This is a non-random error that leads to consistent and repeatable errors and which leads to outcomes. There are a number of concepts that fall under this category. In its most basic sense, a biased sample is one in which some members of the population are more likely to be included than others. In some cases, such as polls organised by newspapers and magazines, the sampling frame comprises the readers of the particular publication, who are likely to make up a highly biased selection according to the degree they reflect the interests, attitudes, sociological, gender, and ethnic approaches of the publication. These should never be taken as representative of the population as a whole.
Although there are different types of bias (see Egger et al., 2001 - BMJ, 323: 42-46), the biases covered in this section are selection, response, and publication.
Selection Bias
Selection bias can occur in any intervention or survey where a population is sampled. There is a possibility that participants are allocated to an arm of an intervention study according to the (generally subconscious) expectations of the allocator. In a survey, this bias may occur where the researcher consistently selects younger participants for a survey which aims to generalise the findings to the general population. This type of bias is distinct from response bias, which is created by the sample that finally contributes to the study, as opposed to being approached to participate in the first place.
This can be avoided by careful use of random allocation, using tables of random numbers or computerised systems, to allocate patients to possible trial arms. This ensures that personal preference does not unduly influence the type of people entering the trial with full awareness of the treatment that is going to be allocated.
Ideally, the person delivering the intervention should also be unaware of which intervention is made (e.g. by having placebo pills made to look identical to the tested therapy). Where the detail is hidden from both allocator and therapist the technique is known as 'double blinding' or 'double masking', and is obviously impossible in some cases (e.g. surgery). Where the trial's statistical analyst is also unaware of which arm was the trial arm it is known as 'triple blinding', which is considered the purest form of design to avoid selection bias.
Response Bias
 Also known as participation bias, this arises where there are consistent differences between those in a population who are invited to participate in a study and those who agree/refuse to do so. The result causes the participating population to differ from the whole population in a systematic way. One example is the characteristics of the non-responders in sexual health population-based surveys. If the purpose of the survey is to estimate the prevalence of HIV, the estimates may be lower than expected if the non-responders or those who refuse to participate are in fact the group with the higher risk. This will result in the wrong conclusions being drawn regarding prevalence levels, which in turn may divert necessary resources away from a population group (see examples 1 and 2).
It is rarely, if ever, that we get a complete count and collection of all relevant data for a whole population. Even the Census, which purports to be the gold standard for the population, can be seriously affected by participation bias. In the middle to late 1990s following a period during which a controversial 'poll tax' had been introduced in the UK, large numbers of young men set about attempting to become invisible to the poll tax register, in order to avoid having to pay the tax. Among other issues, they dropped off electoral rolls. Population estimates were produced by the Office of National Statistics (then OPCS), but when the results of the 2001 Census were known there were about a million fewer men of younger working age counted than had been estimated.
Note that if non-participants are found randomly across the population they do not contribute to bias.
Publication Bias
Publication bias refers to the greater likelihood that studies with positive results will be published . The impact of this type of bias can be substantial as it can lead to a distorted view of the outcomes from particular treatments or also result in some findings (neutral or negative) being suppressed or being published after a long lead time. This also has implications for systematic reviews and meta-analysis, which rely on publications in peer reviewed journals as a major source of information.
Publication bias can be due to a number of factors, from the researcher being more likely to put forward a result with significant differences being observed (as opposed to neutral) for publication, to journal editors being more likely to publish such results. There are a number of reasons why this may occur. Firstly, researchers, sponsors, and journal editors are naturally far more interested in reporting experiments that produce a positive result than those that do not, especially new findings. Inevitably, where trials are limited in size and compare controlled arms to reject the null hypothesis, this results in many trials not being able to reject the null hypothesis at the standard levels of probability. Whilst these are generally written up in the normal way for local use, few are developed into academic papers for learned journals through which they would go into the general knowledge base. Papers which say X has no effect are unlikely to be read widely as they will not lead to changes in practice (except for those who already use X), whereas positive results do lead to changes in clinical practice. Hence there could be a strong publication bias in favour of positive results.
Secondly, there are financial implications for reaching a significant outcome and the interests of the sponsoring organisation may impact on the decisions made regarding publication or suppression of some study outcomes. Studies have shown that trials funded by manufacturers are much more likely to be favourable to the manufacturer's product than independently funded studies. It is now normal for research publications to included details of funding and any conflict of interest the researchers may recognise with published research papers (see examples 1 and 2).
A useful tool for investigating publication bias is the Funnel Plot which graphically compares study sizes with effect sizes. When publication bias is absent, the plot tends to be symmetrical about its midline, whilst when publication bias is present studies cluster on one side of the midline.
Artefacts
It is a consequence of Claud Shannnon's Information Theory that it is impossible to measure an effect without altering the system measured: any measurement involves a transfer of energy into and/or out of the measured system. In physics and signal processing, an artefact is any perceived distortion or other data error caused by the instrument of observation. In organisational terms, this is often referred to as the Hawthorne Effect, named after a factory near Chicago where experiments in productivity were carried out 1924-32. It may be summarised as people behave differently when they are being watched. That is to say, at least some part of what is observed is an artefact of the process of observation.
In social and public health terms, we often have to use concepts that derive entirely from instruments of observation, with results that are highly artefactual. Any individual with a fixed abode (and therefore a postcode in the UK) will be linked to various physical and administrative geographies at which social and health-related concepts are calculated and presented. The Indicators of Multiple Deprivation are issued at Super Output Area level; census data is published at Output Area Level; life expectancy is likely to be calculated at local authority ward level, at LA or PCT level. Without borders we could not talk about, describe or analyse, but each choice of border creates its own set of artefacts.
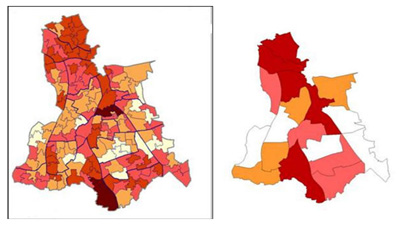
The two maps below show the Index of Multiple Deprivation (IMD) 2004 for the London Borough of Lewisham at, firstly, Lower Super Output Level (SOA), and secondly at electoral ward level. Neither is 'wrong'. The SOA map shows a higher level of variation and granularity; the ward map can be linked to services provided, and is more easily interpreted by local councillors. The maps, and the differences between them, are artefacts of the level of description chosen.
In 2003-5, male life expectancy at birth was about 76.5 years for those born in England, and very similar for the London-born (LB). A male born in LB Lewisham during the same period had a life expectancy of 75. One born in the electoral ward of New Cross (which includes Lewisham) had a life expectancy of only 70. Again, the choice of unit affects the quantity measured.
It has been suggested, given the artefactual nature of the methods, that the entire spectrum of sociological vocabulary may describe only artefacts, with nothing of substance to underpin it. Such claims have been made for the possible explanations of health inequalities in the Black Report (1980), that is, that the association between social class and health is purely an artefact of the way these concepts are measured. This argument is undermined by the fact that inequalities have been demonstrated using a number of different systems of measurement of social class. Nonetheless, health practitioners need to take care in creating and choosing instruments for measurement and analysis, and to be consciously aware of potential artefactual consequences.