For comparison of survival rates, see
For Bayes’ theorem, see
Heterogeneity
Heterogeneity is of particular importance in systematic reviews and meta-analyses, where it relates to differences between studies; differences, for example, in study design, in populations studied and in interventions given. Heterogeneity must be considered before deriving conclusions based on systematic reviews, and its presence may impede the pooling of results from different studies. There are three broad types of heterogeneity: clinical, methodological and statistical.
Clinical heterogeneity refers to differences in the specific research question that was studied, such as differences in the eligible populations, in the interventions and controls, and in the outcome measures.
Methodological heterogeneity describes a variability in study design and in the risk of bias. This can include differences in the interventions given, and in how the outcomes were defined and measured, as well as variations in the use of blinding and allocation concealment. Such methodological heterogeneity may result in different studies actually measuring slightly different things.
Statistical heterogeneity refers to variability in the “true” intervention effects in different studies, and it arises as a consequence of clinical and/or methodological heterogeneity. It results in a variation in effect sizes that are larger than can be expected by chance. Statistical heterogeneity can be identified using Cochran’s Q statistic (a form of chi-squared test of the null hypothesis that the true effect in all included studies are the same), or the I2 test (which uses Cochran’s Q statistic to give a percentage score for heterogeneity, with higher percentages indicating greater heterogeneity).
Cochran’s Q
This is calculated as the weighted sum of squared differences between the effects from individual studies and the pooled effects from all included studies. The Q statistic has a chi-square distribution with (k-1) degrees of freedom, where k is the number of included studies. The resulting Q statistic can be used to generate a p value for the null hypothesis of no heterogeneity. Note that Cochran’s Q has a low power to detect heterogeneity when the number of studies is small (e.g. < 20), as is the case with most meta-analyses. To compensate for this, a higher significance level may be used to determine statistical significance (e.g. p < 0.10).
I-Squared Test
The I2 statistic estimates the proportion of variation across included studies that is secondary to heterogeneity (rather than chance). It is calculated using the Q statistic, as follows:
\({I^2}\left( \% \right) = \;\frac{{Q - df}}{Q}\; \times 100\)
… where df is the degrees of freedom (the number of studies minus 1).
An I2 of zero means that all the variability in effect sizes seen is due to sampling error and not heterogeneity. An I2 value of above 30% may represent at least moderate heterogeneity, but this result needs to be interpreted in context of the actual clinical or methodological features that may have led to the heterogeneity.
Funnel Plots
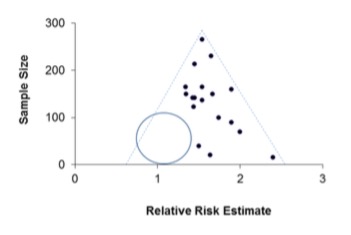
A funnel plot is a specific type of scatterplot, plotting the intervention effect sizes from different studies (on the x-axis) against some measure of the study size or precision (e.g. the inverse of standard error, on the y-axis). It is used to visualise the presence or absence of publication bias. Because the precision of the estimate of the effect size increases with the size of the study, the smaller studies will have more widely scattered effect sizes towards the bottom of the scatterplot, and this variability will reduce as the study sizes increase. The premise is that publication bias will result in smaller studies with non-significant outcomes not being published. If publication bias is present it will result in an asymmetric appearance of the funnel plot, with a unilateral gap towards the bottom of the funnel where the results of the small, negative, unpublished studies should have been (Figure 1). Where publication bias has occurred, a subsequent meta-analysis will result in an overestimation of the true treatment effect.
Figure 1. Hypothetical funnel plot showing the estimated effect size from studies with various sample sizes. The dashed lines (the funnel) indicate the region where 95% of studies would be expected to lie if there were no heterogeneity. If there were no publication bias, one would expect some smaller studies’ results to occupy the empty region bounded by the circle.
References
- Higgins JPT, Green S. Cochrane handbook for systematic reviews of interventions: Wiley 2008
- Sterne JAC. Recommendations for examining and interpreting funnel plot asymmetry in meta-analyses of randomised controlled trials. BMJ 2011;343:d4002
© MJ Campbell 2016, S Shantikumar 2016