Standard Statistical Distributions (e.g. Normal, Poisson, Binomial) and their uses
Statistics: Distributions
Summary
Normal distribution describes continuous data which have a symmetric distribution, with a characteristic 'bell' shape.
Binomial distribution describes the distribution of binary data from a finite sample. Thus it gives the probability of getting r events out of n trials.
Poisson distribution describes the distribution of binary data from an infinite sample. Thus it gives the probability of getting r events in a population.
The Normal Distribution
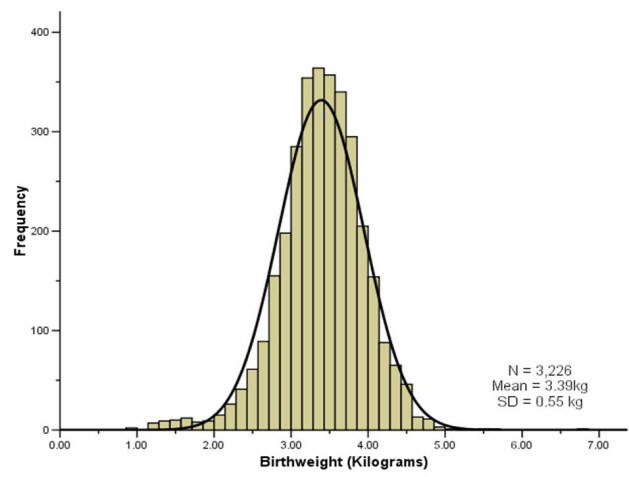
It is often the case with medical data that the histogram of a continuous variable obtained from a single measurement on different subjects will have a characteristic `bell-shaped' distribution known as a Normal distribution. One such example is the histogram of the birth weight (in kilograms) of the 3,226 new born babies shown in Figure 1.
To distinguish the use of the same word in normal range and Normal distribution we have used a lower and upper case convention throughout.
The histogram of the sample data is an estimate of the population distribution of birth weights in new born babies. This population distribution can be estimated by the superimposed smooth `bell-shaped' curve or `Normal' distribution shown. We presume that if we were able to look at the entire population of new born babies then the distribution of birth weight would have exactly the Normal shape. We often infer, from a sample whose histogram has the approximate Normal shape, that the population will have exactly, or as near as makes no practical difference, that Normal shape.
The Normal distribution is completely described by two parameters μ and σ, where μ represents the population mean, or centre of the distribution, and σ the population standard deviation. It is symmetrically distributed around the mean. Populations with small values of the standard deviation σ have a distribution concentrated close to the centre μ; those with large standard deviation have a distribution widely spread along the measurement axis. One mathematical property of the Normal distribution is that exactly 95% of the distribution lies between
\(μ - (1.96 x σ) and μ + (1.96 x σ)\)
Changing the multiplier 1.96 to 2.58, exactly 99% of the Normal distribution lies in the corresponding interval.
In practice the two parameters of the Normal distribution, μ and σ, must be estimated from the sample data. For this purpose a random sample from the population is first taken. The sample mean  and the sample standard deviation, \(SD ({\bar x}) = S\) , are then calculated. If a sample is taken from such a Normal distribution, and provided the sample is not too small, then approximately 95% of the sample lie within the interval:
This is calculated by merely replacing the population parameters μ and σ by the sample estimates and s in the previous expression.
In appropriate circumstances this interval may estimate the reference interval for a particular laboratory test which is then used for diagnostic purposes.
We can use the fact that our sample birth weight data appear Normally distributed to calculate a reference range. We have already mentioned that about 95% of the observations (from a Normal distribution) lie within ±1.96 SDs of the mean. So a reference range for our sample of babies, using the values given in the histogram above, is:
A baby's weight at birth is strongly associated with mortality risk during the first year and, to a lesser degree, with developmental problems in childhood and the risk of various diseases in adulthood. If the data are not Normally distributed then we can base the normal reference range on the observed percentiles of the sample, i.e. 95% of the observed data lie between the 2.5 and 97.5 percentiles. In this example, the percentile-based reference range for our sample was calculated as 2.19kg to 4.43kg.
Most reference ranges are based on samples larger than 3500 people. Over many years, and millions of births, the WHO has come up with a normal birth weight range for new born babies. These ranges represent results than are acceptable in newborn babies and actually cover the middle 80% of the population distribution, i.e. the 10th to 90th centiles. Low birth weight babies are usually defined (by the WHO) as weighing less than 2500g (the 10th centile) regardless of gestational age, and large birth weight babies are defined as weighing above 4000kg (the 90th centile). Hence the normal birth weight range is around 2.5kg to 4kg. For our sample data, the 10th to 90th centile range was similar, 2.75 to 4.03kg.
The Binomial Distribution
If a group of patients is given a new drug for the relief of a particular condition, then the proportion p being successively treated can be regarded as estimating the population treatment success rate  .
.
The sample proportion p is analogous to the sample mean , in that if we score zero for those s patients who fail on treatment, and 1 for those r who succeed, then p=r/n, where n=r+s is the total number of patients treated. Thus p also represents a mean.
Data which can take only a binary (0 or 1) response, such as treatment failure or treatment success, follow the binomial distribution provided the underlying population response rate does not change. The binomial probabilities are calculated from:
\(P\left( {r\;{\rm{responses\;out\;of}}\;n} \right) = \;\frac{{n!}}{{r!\left( {n - r} \right)!}}\;{\pi ^r}{\left( {1 - \pi } \right)^{n - r}}\)
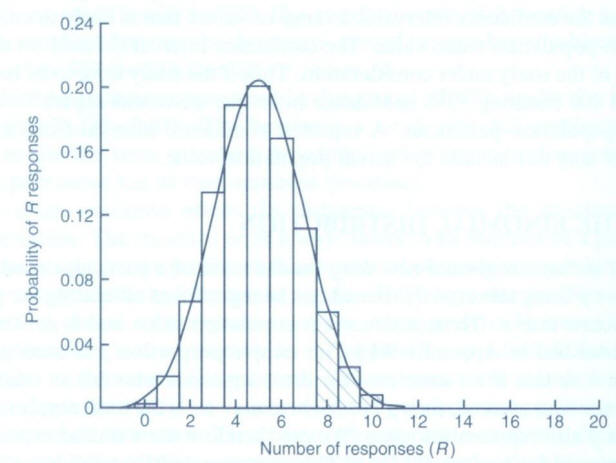
…for successive values of R from 0 through to n. In the above, n! is read as “n factorial” and r! as “r factorial”. For r=4, r!=4×3×2×1=24. Both 0! and 1! are taken as equal to 1. The shaded area marked in Figure 2 (below) corresponds to the above expression for the binomial distribution calculated for each of r=8,9,...,20 and then added. This area totals 0.1018. So the probability of eight or more responses out of 20 is 0.1018.
For a fixed sample size n the shape of the binomial distribution depends only on . Suppose n = 20 patients are to be treated, and it is known that on average a quarter, or =0.25, will respond to this particular treatment. The number of responses actually observed can only take integer values between 0 (no responses) and 20 (all respond). The binomial distribution for this case is illustrated in Figure 2.
The distribution is not symmetric, it has a maximum at five responses and the height of the blocks corresponds to the probability of obtaining the particular number of responses from the 20 patients yet to be treated. It should be noted that the expected value for r, the number of successes yet to be observed if we treated n patients, is (nx). The potential variation about this expectation is expressed by the corresponding standard deviation:
\({\rm{SD}}\left( r \right) = \;\sqrt {n\pi \left( {1 - \pi } \right)}\)
= 5 and σ = √[n(1 - )] = 1.94, superimposed on to a binomial distribution with = 0.25 and n = 20. The Normal distribution describes fairly precisely the binomial distribution in this case. If n is small, however, or close to 0 or 1, the disparity between the Normal and binomial distributions with the same mean and standard deviation increases and the Normal distribution can no longer be used to approximate the binomial distribution. In such cases the probabilities generated by the binomial distribution itself must be used.It is also only in situations in which reasonable agreement exists between the distributions that we would use the confidence interval expression given previously. For technical reasons, the expression given for a confidence interval for a proportion is an approximation. The approximation will usually be quite good provided p is not too close to 0 or 1, situations in which either almost none or nearly all of the patients respond to treatment. The approximation improves with increasing sample size n.
Figure 2: Binomial distribution for n=20 with =0.25 and the Normal approximation
The Poisson Distribution
The Poisson distribution is used to describe discrete quantitative data such as counts in which the population size n is large, the probability of an individual event is small, but the expected number of events, n, is moderate (say five or more). Typical examples are the number of deaths in a town from a particular disease per day, or the number of admissions to a particular hospital.
Example
Wight et al (2004) looked at the variation in cadaveric heart beating organ donor rates in the UK. They found that there were 1330 organ donors, aged 15-69, across the UK for the two years 1999 and 2000 combined. Heart-beating donors are patients who are seriously ill in an intensive care unit (ICU) and are placed on a ventilator.
Now it is clear that the distribution of the number of donors takes integer values only, thus the distribution is similar in this respect to the binomial. However, there is no theoretical limit to the number of organ donors that could happen on a particular day. Here the population is the UK population aged 15-69, over two years, which is over 82 million person years, so in this case each member can be thought to have a very small probability of actually suffering an event, in this case being admitted to a hospital ICU and placed on a ventilator with a life threatening condition.
The mean number of organ donors per day over the two year period is calculated as:
\(r = \;\frac{{1330}}{{\left( {365 + 365} \right)}} = \;\frac{{1330}}{{730}} = 1.82\) organ donations per day
It should be noted that the expression for the mean is similar to that for , except here multiple data values are common; and so instead of writing each as a distinct figure in the numerator they are first grouped and counted. For data arising from a Poisson distribution the standard error, that is the standard deviation of r, is estimated by SE(r) = √(r/n), where n is the total number of days (or an alternative time unit). Provided the organ donation rate is not too low, a 95% confidence interval for the underlying (true) organ donation rate λ can be calculated in the usual way:
\(r - \left[ {1.96\; \times {\rm{SE}}\left( r \right)} \right]\;\;{\rm{to\;\;}}r + \left[ {1.96{\rm{\;}} \times {\rm{SE}}\left( r \right)} \right]\)
The Poisson probabilities are calculated from:
\(P\left( {r\;{\rm{responses}}} \right) = \frac{{{\lambda ^r}}}{{r!}}{e^{ - \lambda }}\;\)
…for successive values of r from 0 to infinity. Here e is the exponential constant 2.7182…, and λ is the population rate which is estimated by r in the example above.
Example
Suppose that before the study of Wight et al. (2004) was conducted it was expected that the number of organ donations per day was approximately two. Then assuming λ = 2, we would anticipate the probability of 0 organ donations in a given day to be (20/0!)e-2 =e-2 = 0.135. (Remember that 20 and 0! are both equal to 1.) The probability of one organ donation would be (21/1!)e-2 = 2(e-2) = 0.271. Similarly the probability of two organ donations per day is (22/2!)e-2= 2(e-2) = 0.271; and so on to give for three donations 0.180, four donations 0.090, five donations 0.036, six donations 0.012, etc. If the study is then to be conducted over 2 years (730 days), each of these probabilities is multiplied by 730 to give the expected number of days during which 0, 1, 2, 3, etc. donations will occur. These expectations are 98.8, 197.6, 197.6, 131.7, 26.3, 8.8 days. A comparison can then be made between what is expected and what is actually observed.
Other Distributions
A brief description of some other distributions are given for completeness.
t-distribution
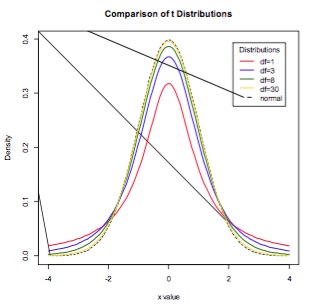
Student’s t-distribution is a continuous probability distribution with a similar shape to the Normal distribution but with wider tails. t-distributions are used to describe samples which have been drawn from a population, and the exact shape of the distribution varies with the sample size. The smaller the sample size, the more spread out the tails, and the larger the sample size, the closer the t-distribution is to the Normal distribution (Figure 3). Whilst in general the Normal distribution is used as an approximation when estimating means of samples from a Normally-distribution population, when the same size is small (say n<30), the t-distribution should be used in preference.
Figure 3. The t-distribution for various sample sizes. As the sample size increases, the t-distribution more closely approximates the Normal.
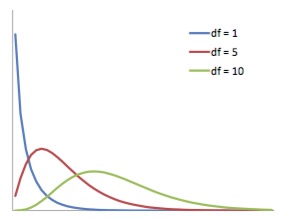
The chi-squared distribution is continuous probability distribution whose shape is defined by the number of degrees of freedom. It is a right-skew distribution, but as the number of degrees of freedom increases it approximates the Normal distribution (Figure 4). The chi-squared distribution is important for its use in chi-squared tests. These are often used to test deviations between observed and expected frequencies, or to determine the independence between categorical variables. When conducting a chi-squared test, the probability values derived from chi-squared distributions can be looked up in a statistical table.
Figure 4. The chi-squared distribution for various degrees of freedom. The distribution becomes less right-skew as the number of degrees of freedom increases.
References
- Altman D.G., Machin D., Bryant T.N., & Gardner M.J. Statistics with Confidence. Confidence intervals and statistical guidelines (2nd Edition). London: British
Medical Journal, 2000 - Campbell MJ, Machin D and Walters SJ. Medical Statistics: a Commonsense Approach 4th ed. Chichester: Wiley-Blackwell 2007
- O'Cathain A., Walters S.J., Nicholl J.P., Thomas K.J., & Kirkham M. Use of evidence based leaflets to promote informed choice in maternity care: randomised
controlled trial in everyday practice. British Medical Journal 2002; 324: 643-646. - Melchart D, Streng a, Hoppe A, Brinkhaus B, Witt C, et al Acupuncture in patients with tension-type headache: randomised controlled trial BMJ 2005;331:376-382
- Wight J., Jakubovic M., Walters S., Maheswaran R., White P., Lennon V. Variation in cadaveric organ donor rates in the UK. Nephrology Dialysis Transplantation
2004; 19(4): 963-968, 2004.
© MJ Campbell 2016, S Shantikumar 2016