
PLEASE NOTE:
We are currently in the process of updating this chapter and we appreciate your patience whilst this is being completed.
Conducting Surveys, Including Questionnaire Design
A survey is a study design that collects the same data on each case in the sample. This produces a standard set of data for each subject that can be analysed statistically to look for patterns and relationships between the variables assessed. Examples include large national household surveys, such as the Health Survey for England, as well as smaller surveys, for example asking hospital patients about their experiences. Surveys can be used to gather information on a range of topics relevant to healthcare, such as health behaviours and public attitudes.
If well designed, with a large enough representative sample, surveys can generate useful generalisable data which can generate hypotheses for further research. However, surveys cannot answer questions about causation.1
Steps in Designing and Conducting a Survey2
There are several steps which should be considered when designing a survey:
1. Establish the goals of the project - what do you want to learn? This will determine who you survey and what you will ask them.
2, Determine your sample – different sampling methods are covered elsewhere (“Methods of sampling from a population”). However, there are two principal components to choosing a sample:
- Who are you target population?
- How many people will you interview? This may involve a trade-off between the benefits of a large sample versus the costs of interviewing a large number of people
3. Choose interview methodology – determining the method of data collection. Possible methods include:
- Personal face-to-face interviews
- Telephone surveys
- Mail surveys
- Internet surveys
4. Design your survey – this is addressed in the subheading Questionnaire Design, below.
5. Pilot the questionnaire with the target group – this may reveal unanticipated problems with layout, question wording, instructions, etc. It also tests whether the questionnaire can be administered in a reasonable amount of time and helps to rephrase or re-structure questions, for example if the range of responses is inadequate. It may also be important to determine whether the questionnaire is culturally acceptable to study participants, as well as whether it generates reliable and consistent answers.
6. Conduct interviews and enter data
7. Analyze the data and write the report
Survey documentation
The principal documentation in a survey is the questionnaire itself, or the paperwork used to record subjects’ responses. However the document linked here, describing the Malaria Indicator Survey3 carried out by the World Health Organisation and other groups, illustrates the range of other documents that can be produced to accompany a survey.
This includes the questionnaires used with participants, but also manuals for both the interviewers and their supervisors, other documentation for training, and guidelines for sampling. Consequently, the methods are transparent and could be replicated by other investigators. However, more importantly, it helps to ensure that the methods used are rigorous and there is minimal variation in the techniques used by different interviewers.
Questionnaire design
Questionnaires may be used as the sole instrument for the collection of survey data, or in combination with other instruments of data collection. The degree to which a questionnaire produces data that is relevant and valid to a study’s goals and objectives will depend on how well the questionnaire is designed, how well the questions are constructed and how well it is administered.
A valid questionnaire measures what it claims to measure. For example, a self-completed questionnaire that seeks to measure food intake may be invalid because it measures what participants say they have eaten, not what they have actually eaten.4 Careful consideration of the aims and objectives of the study is crucial if the questionnaire is to yield responses that are both valid and reliable.
Perhaps the most important guidance at the design stage is ‘KISS’ (“keep it short and simple”). If you present a 20-page questionnaire most potential respondents will give up in horror before even starting.2
Overall design1
The language used in a questionnaire should be clear and simple, with short sentences. Abbreviations and jargon should be avoided, and the language should be appropriate for the target audience. Professional production methods will also convey the impression that the questionnaire is important.
The questionnaire should start with non-threatening, interesting items, and ideally the most important questions should be included in the first half as respondents may return incomplete questionnaires. Questions should be grouped in coherent categories, leaving sufficient space for responses, and the questionnaire should be easy to navigate.
The question format should be varied to prevent participants producing repetitive answers as their attention wanes (known as habituation).
Types of question
The first task when generating questions is to choose the variables you want to measure. This may be done purely theoretically, for example, covering the issues you think are important, by using a focus group or interviews to determine what is important to the target group, or by identifying important variables via a literature search. Questions may generate either numerical answers, which can be analysed quantitatively, or text-based examples, which may require a qualitative style of analysis.
There are two main types of question: 4
- Closed questions limit the response to a specified list of possible answers. This may either be ‘Yes/No’ or a multiple choice format. This has a number of advantages for the researcher, including providing a set of standard responses that enable researchers to produce aggregated data quickly. However, the richness of potential responses is limited.4 Closed questions may also fail to include all potential responses, leading to biased results. Where appropriate, closed questions should also include an open-ended question following 'Other' or 'Don't Know' responses.
- Open questions allow the respondent to answer freely. However, if open-ended questions are used, the methods for analysing these responses is more complex.4
Participants may also be asked to mark their answer on a rating or agreement scale. Qualitative study designs, which may involve a more in-depth interview with participants, are discussed in elsewhere syllabus (see Section 1D - “The principles of qualitative methods”).
Maximising response rates
In order to produce results that are representative, it is important to aim for the highest response rate possible. Potential barriers to participant accuracy and honesty include:1
- Excess mental demands – for example, difficulty understanding the question, difficulty in recalling moods and events over time
- Biases in answering the question – for example, social desirability (seeking to present oneself in the best light), recall bias, or end avoidance (respondents choosing not to give extreme answers on a continuous scale).
Other tips to improve response rates include:
- Notifying participants in advance with a letter of introduction outlining the purpose of the study
- Using a clear and simple layout
- Using clear and concise questions which avoid the use of technical jargon, and long, leading or negative questions
- Inclusion of a stamped addressed envelope if conducting a postal survey, or collection of questionnaires if feasible
- Ensuring anonymity where possible, especially if the questionnaire includes sensitive items
- Follow-up of non-responders by telephone or letter
- Rewards for completing the questionnaire, such as a free gift or donation to charity
Assessing the Validity of Observational Techniques
Validity
The validity of an instrument is the extent to which it measures what it is intended to measure.
Streiner and Norman describe validation as a process of hypothesis testing: “Someone who scores highly on this measure will also do well in situation A, perform poorly on test B, and will differ from those who score poorly on the scale for traits C and D.”6
More detail on the types of validity can be found in the chapter “Validity, reliability and generalisability”.
Assessing the validity of observational techniques
Observational techniques involve measuring phenomena in their natural setting. In practice, there are two broad approaches for assessing validity:
- A test may be compared with the best available clinical assessment. For example, a self-administered psychiatric questionnaire may be compared with the majority opinion of an expert psychiatric panel.
- Alternatively, a test may be validated by its ability to predict some other relevant finding or event, such as the ability of glycosuria (glucose in the urine) to predict an abnormal glucose tolerance test, or of a questionnaire to predict future illness.
Subjects are classified as positive or negative for the outcome, first on the basis of the survey or new instrument, and then according to the reference test. The findings can then be expressed in a 2x2 contingency table.
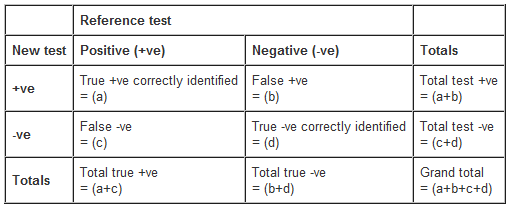
From this table several important statistics can be derived.
- Sensitivity (a/a+c) - a sensitive test detects a high proportion of the true cases
- Specificity (d/b+d) - a specific test has few false-positives
- Systematic error (a+b)/(a+c) - the ratio of the total numbers positive from the new test compared with the reference tests. This indicates the proportion of counts that were correct.
- Positive predictive value - the proportion of test positives that are truly positive.
These statistics are addressed in more detail in Section 2C (“Diagnosis and Screening”).
The validity of observational techniques can be improved in various ways:
- Training observers and consider the setting of observation
- Ensure an appropriate and representative sample, and consider the effect of reflexivity (the effect of observation and the observer on participants)
- Ensure the results of observations are accurately recorded, for example by having two observers, or by recording spoken responses
- Triangulate responses by repeating observations, or by assessing the outcome of interest with additional instruments
For further information on the science of questionnaire design, readers are directed to the referenced BMJ publications4,5,7,8.
References
- Durand M, Chantler T. Principles of Social Research (2nd ed.), Open University Press, 2014
- http://www.surveysystem.com/sdesign.htm - Accessed 8/04/17
- http://www.malariasurveys.org/toolkit.cfm - Accessed 8/04/17
- Boynton, PM, Selecting, designing, and developing your questionnaire. BMJ 2004;328:1312-1315
- Boynton, PM, Administering, analysing, and reporting your questionnaire. BMJ 2004;328:1372-1375
- Streiner D, Norman G. Health measurement scales: A practical guide to their development and use (3rd ed). Oxford University Press, 2003
- Rose G, Barker D. Repeatability and validity. BMJ 1978; 2:1070-1071
- Barbour R. Checklists for improving rigour in qualitative research: a case of the tail wagging the dog? BMJ 2001;322:1115-1117
© Helen Barratt, Maria Kirwan 2009, Saran Shantikumar 2018