Introduction
 Learning objectives: You will learn about direct and indirect standardisation, selection of strata and the calculation of birth and mortality rates.
This section covers the rates and ratios that are commonly used in healthcare. In both undertaking data analysis and using data to inform decision-making, it is essential to understand the birth and mortality ratios.
Read the resource text below.
Resource text
Definitions and description
Rates and ratios are cornerstones in understanding the health, morbidity, and mortality of populations. Plain numbers of events, such as deaths, or births, or hospital admissions have very little meaning in themselves, lacking a context in which they can be interpreted. Calculating rates provides such a context, by transforming the data in terms of the population at risk and the relevant time period.
A rate is a quantity in one dimension divided by a quantity in (usually) another dimension, with an indication of time. For example,
The Annual Incidence Rate of an acute disease is
= number of new cases / population at risk, observed within a year.
The Point Prevalence Rate of a condition is
= number of cases at a particular point in time / population at risk
Note that in the case of incidence we are concerned only with the start of an illness, so we need to specify the period of observation (x cases per thousand people per year) while in the case of prevalence we are looking at a snapshot, and the item is expressed in terms of cases per thousand people, or percentage of the population with the condition at any one time.
The distinction is especially important in conditions such as HIV, where incidence rates describe the pattern of new cases, while prevalence describes the population living with the condition.
Methods of comparison - Standardisation
 Rates may be expressed as 'crude rates' where the denominator includes all the population, for example All Age All Cause Mortality, which is used as a rough headline figure for assessing overall public health. Crude rates may hide significant differences in risk between subgroups of the populations where there are large differences in the make-up of populations, especially in terms of age. More generally useful are rates which have been stratified in such a way as to present data separately where there are significant differences among different sectors of the population. The most commonly used stratifications are by age (or more often, age-band) and sex, these being both the most important determinants of many health issues and also the most complete data items available. However, given sufficient reliable data, other groupings such as ethnicity or socio-economic status can be used in the calculations. Such stratified data can then be used in conjunction with similarly stratified data for other populations to derive what are known as Standardised Rates. These enable comparison of local data with other areas, and at a national level. Comparison is done between observed data and 'expected' data. The two methods of standardisation, Direct and Indirect, both generate population-weighted averages, but differ in their expected data and in the inferences that may be drawn from them.
Direct Standardisation
This is the expected mortality rate in the reference population if it were to experience the mortality observed in the index population. It is typically expressed in terms of per 1000, although it could also be expressed per 100,000 depending on the population sizes involved.
This requires:
- local 'index' population, stratified as required (here we will use age band only, for simplicity), at PCT or ward population for example.
- age-specific counts for the event of interest (e.g. mortality) in the index population
- "reference population for comparison purposes. This can be a 'real' population (e.g., England & Wales Office of National Statistics mid-year estimates), or an artificial population such as the 'Standard European Population', which is used by the Department of Health for its national standardised data
- for both types of standardisation, ranks can be affected by the structure of the reference population.
- for direct standardisation, the reference population need not be a real population, and nationally presented figures are often issued using artificially constructed populations such as the 'Standard European Population', but many people prefer to use the complete population of England or England and Wales.
- for indirect standardisation it is essential to use the same population as the reference mortality rates were calculated from. It is important to be sure whether incidence figures are for England, England & Wales, or the entire United Kingdom. If incidence data is taken from the Hospital Episodes Statistics (HES) database, the population should be the population of England (use the mid year estimates for the year in question), as only English data is included in HES.
- for local and regional studies, standardising to the total population of the area studied can yield valuable insights. Such an approach could usefully be applied to, for example, an investigation into health inequalities in mortality rates at ward level.
- economic prosperity
- employment levels
- marriage/co-habitation patterns
- contraceptive availability and usage
- pelvic inflammatory disease, for example, resulting from Chlamydia and gonorrhoea
- decreasing sperm count
The method is to:
1. derive for each stratum the age-specific rate for the event,
2. apply the result to the equivalent stratum of the reference population,
3. sum the strata to get the total expected deaths
4. divide by the total reference population to get the rate.
If there are n age-bands, 'indop' is the stratified index population, and reference population the similarly stratified 'refpop', then the Directly Age Standardised Rate (DASR) is:
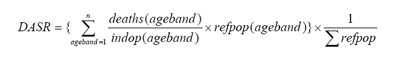
The main advantage of using DASRs is that by performing these calculations for several index populations (eg PCTs) the mortalities in these populations can be compared without the confounding factor of age. A potential disadvantage is that when based on very small numbers of deaths (or other events) the rates can become unstable.
A worked example of direct standardisation can be found here:
http://www.avon.nhs.uk/phnet/Methods/directly_age_standardised_rates.htm
Another, more theoretical example, including a formula for approximate 95% confidence intervals, is at
www.chi.nhs.uk/Ratings/Downloads/direct_standardn_meth.pdf
An example using hospital admission rates (rather than mortality) can be found at www.yhpho.org.uk/hesData.aspx
Indirect Standardisation
 Indirect standardisation applies a similar process, in reverse. This is a comparison between the number of deaths observed in a local population and the number of expected deaths in a reference population, based on the assumption that the age-specific death rates are the same as the reference population. Therefore, the age-stratified incidence rates for a known reference population are applied to local index population structures, to arrive at mortality rates which would have been experienced locally if the index population had experienced mortality at the reference rates. The results are summed, and the ratio of the locally observed to the expected mortality calculated to give the Standardised Mortality Ratio (SMR), often multiplied by 100. An SMR>100 implies higher mortality than the national average, and vice versa.
SMR = Observed Mortality x 100
Expected
Advantages of using SMRs are that they are easily understood, and do not need data on local stratified incidence rates. A disadvantage is that because local age strata are not used, different local populations' SMRs cannot be compared with each other, as differences in local population structures are not taken into account. Thus if two PCTs A and B have SMRs of 120(A) and 110(B), it is valid to say they each have higher than average mortality, but not to say that A is 10% worse than B, as A and B may have radically different age structures.
A worked example of indirect standardisation can be found here, with an Excel template:
http://www.avon.nhs.uk/phnet/Methods/indirectly_age.htm
Another, more theoretical example, including a formula for approximate 95% confidence intervals, is at NHS Performance Indictaors.
Issues Relating to Selection of Data
Choice of reference population
Selection of strata
In age-banding, there needs to be some attention paid to granularity. This will generally need to be a compromise between what is reasonably obtainable and what would give optimum calculated results. For most purposes, five-year age bands are adequate. HES is available pre-analysed in 0-14, 15-59, 60-75, >75 age bands. This is rather crude, though can still be useful for some purposes. If studying female fertility, this banding would be useless, as all fertile ages are included in one band. Studies of teenage pregnancy may need to stratify individual years of age. Access to HES data is available to NHS organisations via trusted providers (typically, Public Health Observatories), who will produce bespoke analyses on receipt of certain undertakings about data privacy and confidentiality.
Ethnic data is available via HES and associated datasets, and data quality in this area has improved considerably in recent years. Stratification by ethnic group is a possible analysis for patients admitted to hospital. However, this data item is missing from death registrations so cannot be used for mortality studies. Social class is rarely present in any health data, so while it is known to be a major indicator (or determinant) of health, it tends to be a factor only in specially commissioned research studies.
Indices of fertility
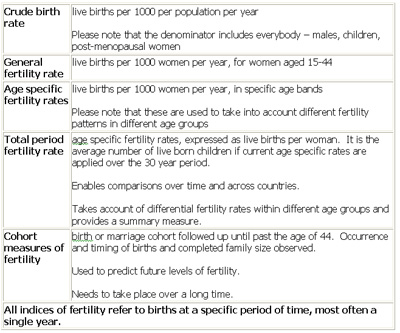
Factors that influence trends:
Factors affecting physiological reproductive capacity:
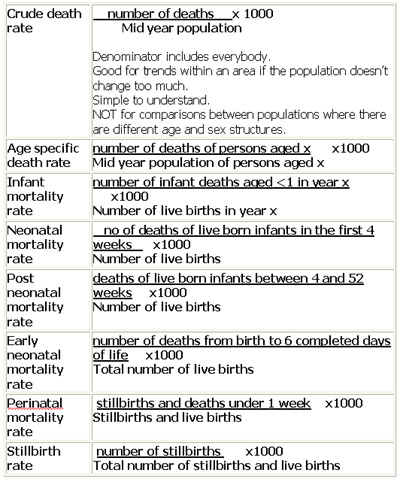
Mortality rates
(N.B. rates are often expressed as 'per 1000' as denoted below but not necessarily). Please note that stillbirth is defined as the birth of a stillborn fetus after 24 weeks of gestation; the death can occur in the fetus, during labour or delivery.