
Introduction
Learning objectives: You will learn about basic reproductive rate, effective reproductive rate, epidemic thresholds, and epidemic curves.
Read the resource text below.
Resource text
Basic reproduction rate - (R0)
The basic reproduction rate, R0, is used to measure the transmission potential of a disease. The basic reproduction rate of microparasitic diseases (those caused by viruses and bacteria) is defined as the expected number of secondary cases produced by a primary case in a population that is completely susceptible.
The basis reproduction rate can be measured by counting the number of secondary cases following the introduction of an infection into a totally susceptible population.
Example: If R0 for influenza in a population is 12, then we would estimate that one person with influenza introduced into that population would result in 12 new secondary cases of influenza.
Note that R0 excludes new cases produced by the secondary cases etc.
The basic reproductive rate is affected by several factors:
- The rate of contacts in the host population.
- The probability of infection being transmitted during contact.
- The duration of infectiousness.
In general, for an epidemic to occur in a susceptible population R0 must be >1.
In many circumstances not all contacts will be susceptible to infection. That is, some contacts will be immune, for example due to prior infection which has conferred life-long immunity, or as a result of previous immunisation. Therefore, not all contacts will become infected and the average number of secondary cases per infectious case will decrease.
This is measured by the effective reproductive rate (R)
Effective reproductive rate (R)
The effective reproductive rate (R) estimates the average number of secondary cases per infectious case in a population made up of both susceptible and non-susceptible hosts.
R = R0x
That is, the net reproductive rate is the basic reproductive rate discounted by the fraction of the host population that is susceptible (x).
For example, if R0 for influenza is 12 in a population where half of the population is immune, then the effective reproductive rate for influenza is 12 X 0.5 = 6. Therefore, under these circumstances a single case of influenza would produce an average of 6 new secondary cases [1].
Epidemic thresholds
The epidemic threshold is the number of susceptible individuals within a population that is required for an epidemic to occur.
Herd immunity
Herd immunity is the proportion of the population that is immune to a particular infectious disease.
Herd immunity threshold (HIT)
The HIT is the proportion of a population that need to be immune in order for an infectious disease to become stable. If this is reached, for example, due to immunisation, then each case leads to a single new case and the infection will become stable within the population. That is, (R=1).
In addition, if the threshold is surpassed then R<1 and the disease will die out.
HIT = (R0 -1) / R0 or 1 - (1/ R0)
The threshold is one where on average all but one of the potential contacts of a case is immune.
This is an important measure used in infectious disease control and immunisation and eradication programmes.
Techniques for infectious disease data: Epidemic curves
An epidemic curve is a graph showing the distribution of the onset of cases of an infectious disease in relation to the onset of illness. The time interval for the onset of illness used will be determined by the incubation period.
Epidemic curves are used primarily in infectious disease outbreak investigations.
Use of epidemic curves
Epidemic curves are a useful epidemiological method in outbreak investigations and are used to;
- Determine the type of epidemic (common source, point source, propagated)
- Determine the difference between the maximum and minimum incubation period.
- Estimate the likely time of exposure.
- Determine incubation period in cases where the time of exposure is known.
A common source epidemic results from infection of a large number of people from a single contaminated source [2]. A point source epidemic occurs when lots of people are exposed simultaneously to a source of infection such as food or water [3] and the resultant cases develop within one incubation period of the disease. Propagated epidemics are caused by the transmission of an infectious agent from one person to another, e.g. whooping cough [4].
Figure 1: Epidemic curve for confirmed cases of E. coli.
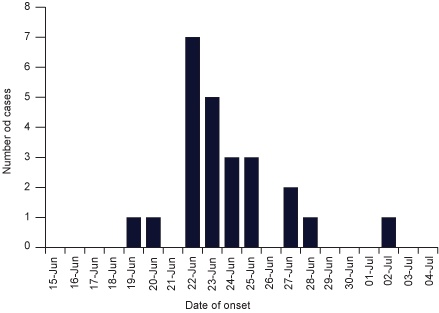
Obtained from the Health Protection Agency, UK [5].
Figure 1 is an example of an epidemic curve for a small outbreak of E. coli in a London primary school. 43 people tested positive, 19 of these were asymptomatic. The clustering around the 22nd/23rd of June suggests a common source for this epidemic.
References
1. Rothman KJ, Modern Epidemiology, Lippincott Williams & Wilkins, 1998.
2. Centre for cancer education. Common-source epidemic. [online] [accessed 10/08/2008].
3. British Medical Journal. Outbreaks of disease. [online] [accessed 10/08/2008].
4. Farmer, R. Lawrenson, R. 2004. Lecture notes in Epidemiology and Public Health Medicine. p108 5th Edition. Blackwell Publishing.
5. Health Protection Agency 2006. Communicable Disease Report weekly. [online] [Accessed 10/08/2008].
Related links