
Statistics: Glossary
Analysis of variance (ANOVA). A form of linear model with a continuous outcome variable and categorical input variables.
Analysis of covariance (ANCOVA). A form of linear model with a continuous outcome variable, some categorical input variables and usually just one continuous input variable.
Autoregressive model. A model for a time dependent outcome variable which in which the error term includes past values of itself
Bayesian methods. Methods which allow parameters to have distributions. Initially the parameter θ is assigned a prior distribution P(θ), and after data, X, have been collected a posterior distribution P(θ|X) is obtainedusing Bayes' Theorem, which links the two via the likelihood p(X| θ).
Binary variable. A variable which can take only two values, say 'success' and 'failure'
Binomial distribution. The distribution of a binary variable when the probability of a 'success' is constant.
Bootstrap. A computer intensive resampling method to calculate standard errors without relying on model assumptions.
Censored data. An observation is censored at X if all we know is that the observation is greater than or equal to X. Often used with survival data, where all we know is that a subject has survived X amount of time.
Cluster randomised trial. A trial in which the subjects are randomised in clusters.
Conditional logistic regression. Used to analyse binary data from matched case-control studies, or from cross-over trials.
Confidence Interval. A 95% confidence interval displays the degree of uncertainty about the population parameter provided by the sample estimate
•makes allowance for sampling error in estimation of summary statistic
•technically, if one conducted the same study, with the same sample size, 100 times, and on each occasion one calculated a 95% CI,, then we would expect 95% of these intervals to cover the true population parameter. The key point is these intervals don't come labeled with 'good' or 'bad' labels, and we have only one interval, so we expect to cover the true population with 95% 'certainty'.
•If the null hypothesis is that an estimator is zero (for example for a difference in means or proportions) and if a 95% CI includes 0, then P>0.05 & the result is 'non-significant'
•If the null hypothesis is that an estimator is unity (for example for an odds ratio or relative risk) and if a 95% CI includes 1,then P>0.05 & the result is 'non-significant'
Design effect. The amount that a variance of an estimator has to be inflated to allow for clustering, or other aspects of the sampling scheme.
Dummy variables. Binary variables used for fitting categorical terms, in which each dummy takes the value 0 or 1, and if there are n categories, there are n-1 independent dummy variables
Deviance A measure of how far a set of data varies from a perfect fit to a model. For Normally distributed residuals it is equal to the residual sum of squares.
Effect modification Given a model between in an input variable and an outcome, effect modification occurs if the observed relationship is changed markedly when a third variable is included in the model. An extreme example of this is Simpson'sparadox.
Fixed effect. A term in a model that can be fitted using dummy variables. The assumption is that if a new set of data were to be collected, the population parameter would be the same (fixed). Thus the effect of an intervention in atrial is assumed fixed.
Forest plot. A plot used in meta analysis. Usually it comprises a series of estimates and confidence intervals from the component studies, and a summary estimate and confidence interval. Supposedly named because it appears like a setof trees.
Funnel plot. A plot used in meta analysis to try and detect publication bias. It comprises a plot of the precision of estimates of treatment effects from component studies versus the estimate itself.
Generalised Estimating Equations (GEE) A set of equations for estimating parameters in a model, essentially equal to iteratively re-weighted least squares. They are commonly used with a sandwich estimator to obtain thestandard error. There is also GEE2 includes the variance estimators in the set of equations.
Hazard Rate: The probability per time unit that a case that has survived to the beginning of the respective interval will fail in that interval. Specifically, it is computed as the number of failures per time units in the respectiveinterval, divided by the average number of surviving cases at the mid-point of the interval.
Hazard Ratio (Relative Hazard): Hazard ratio compares two groups differing in treatments or prognostic variables etc. If the hazard ratio is 2.0, then the rate of failure in one group is twice the rate in the other group. Can be interpretedas a relative risk.
Hosmer-Lemeshow statistic. A measure of the goodness of fit of a logistic regression when at least one of the explanatory variables is continuous.
Influential points. In regression analysis, points which, if deleted and the model refitted, would have a big effect on at least one of the model parameters.
Kaplan-Meier plot. An empirical plot of the probability of survival on the y axis by survival time on the x-axis. Censored observations can be incorporated in the plot.
Least-squares. A method of estimating parameters in a model when the outcome is continuous. It chooses parameters which minimise the residual sum of squares.
Leverage points: In regression analysis, observations that have an extreme value on one or more explanatory variable. The leverage values indicate whether or not X values for a given observation are outlying (far from the main bodyof the data). They may be influential points
Likelihood: The probability of a set of observations given a model. If the model has a single parameter θ, it is denoted P(X| θ), where X denotes the data.
Likelihood ratio test: A general purpose test of model M0 against an alternative M1 where M0 is contained within M1. It is based on the ratio of two likelihood functions one derived from each of Hoand H1. The statistics -2 ln (LM0 / LM1) has approximately a χ2 distribution with df equal to the difference in the number of parameters in the two models.
Linear model A model which is linear in the parameters, but not necessarily in the variables. Thus y=β0+β1X+ β2X2 is a linear model but y=exp(β0+β1X)is not
Least-squares A method of fitting a linear model by minimising the residual sum of squares. Weighted least squares applies weights to the residuals, usually the inverse of a variance estimate. Iteratively reweighted least squaresallows the weights to vary depending on the current fitted values and so requires iteration to be solved.
Logit transform. If 0
Logistic regression. Used to analyse data where the outcome variable is binary. It uses the logistic transform of the expected probability of 'success'.
Maximum likelihood. A method of fitting a model by choosing parameters that maximises the likelihood of the data.
Meta-analysis. A method of combining results from different studies to produce a overall summary statistic, usually in clinical trials.
Mixed model. A model that mixes random and fixed effect terms
Multiple linear regression. Often just known as multiple regression. Used to analyse data when the outcome is continuous and the model is linear.
Null hypothesis
•For comparing two samples the assumption under the null hypothesis is that they both came from the same population
•type 1 error: occurs when null hypothesis is true and wrongly rejected, i.e. conclude significant difference exists when in reality doesn't
•type 2 error: occurs when null hypothesis is wrongly accepted when false, i.e. missing a true difference
NNT: Number Needed to Treat. An estimate of number of patients that would need to be treated under a new treatment for one more of them to achieve the desired outcome than under the standard treatment
•NNT = 1/ARR (absolute rate reduction)
•method of expressing trial outcomes
•possibly more easily applicable to clinical practice than OR/RR. However, be aware that it is dependent on the baseline incidence rate, and so cannot be interpreted without knowledge of the baseline incidence.
Example NNT 1.2 ~ for Helicobacter eradication, NNT 40 for preventing death with aspirin after MI
NNH: Number Needed to Harm. Number of patients that a physician would have to treat with a new treatment to harm one extra patient who would otherwise have not been harmed. Harm may be an adverse reaction, or treatment failure, death etc.
Odds. If p1 is the probability of a success, the odds is the ratio of the probability of a success to a failure p1/(1-p1).
Odds ratio. Used as a summary measure for binary outcomes. If p1 is the probability of a success in one group and p2 the probability of success in another, then the odds ratio is {p1/(1-p1)}/{p2/(1-p2)}.
Ordinal variable. A categorical variable, where the categories can be ordered, such as pain scores of 'mild', 'moderate' and 'severe'.
Ordinal regression. Used to analyse data when the outcome variable is ordinal. Usually uses the proportional odds model or the continuation ratio model.
Overdispersion. In a Poisson and Binomial model, the variance of the outcome is determined by the mean value. When the observed value exceeds this predicted value, the data are said to be overdispersed. This can happen when the counts arecorrelated.
Proportional hazards model (also known as the Cox model).Used to analyse survival data. The main assumption is if an explanatory variable is binary, then the hazard ratio for this variable is constant over time.
Proportional odds model. Used when outcome is ordinal. Suppose we have an ordinal outcome with 3 categories and a binary explanatory variable. A proportional odds model assumes that the odds ratio for the outcome variable comparing levels 1and 2 of the outcome is the same as the odds ratio for the outcome variable comparing levels 2 and 3
Poisson distribution. The distribution of a count variable when the probability of an event is constant.
Poisson regression. Used to analyze data when the outcome variable is a count.
Power. The Power of a test is the probability of declaring a result significant when the null hypothesis is false. It is denoted by 1- β
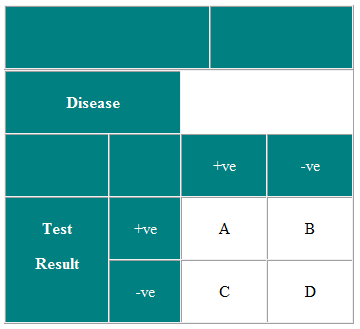
Predictive values
Positive predictive value (PPV) of a test
PPV is the probability that a subject who tests positive will be a true positive i.e. has the disease and is correctly classified i.e. how good the test is at finding people with disease in screening situation, prevalence is small & PPV low.
PPV=A/(A+B)
Negative predictive value (NPV) of a test
NPV is the probability that a subject who is test negative will be a true negative i.e. someone. doesn't have disease and is correctly classified... how good a test is at identifying people without disease
NPV=D/(C+D)
PPV & NPV both depend on prevalence of disease, sensitivity & specificity
where 2X2 table values are:
Publication bias A phenomenon when some studies which have been conducted fail to be published. It usually occurs because studies that have positive findings are more likely to be written up and submitted for publication, and editors aremore likely to accept them
p value (probability value (p) or significance value)
p is the probability that under null hypotheses of getting the observed result (or one more extreme)
•calculate using significance test
•P
•P > 0.05: result not statistically significant. Two groups are not significantly different and chance can not be excluded as potential explanation of association
Random effects model. A model with more than one random (or error) term. The assumption is that if the study was done again, the terms would estimate different population parameters, in contrast to a fixed effects model. Thus in alongitudinal study, the effect of a patient on the intervention effect is assumed random.
Relative risk. Used as a summary measure for binary outcomes for prospective studies. If p1 is the probability of success in one group and p2 the probability of success in another, the relative risk is p1/p2.If p1 and p2 are the incidences of an event, then the relative risk is also the incidence rate ratio
Robust standard error. Also known as a sandwich estimator. A method of estimating standard errors of parameters without assuming the error variances are homogenous.
Sandwich estimator A robust standard error, so-called because the matrix formulation is like a 'sandwich' ABA, where A is the 'bread' and B the 'filling'.
Simpson's paradox. This occurs when one has binary input and output variables and a third variable which is related to both. When a model is fitted that does not include the third variable the observed relationship between the input andoutput variables is in one direction, and when the third variable is included in the model the direction of the relationship is reversed.
Score test. A measure of the fit of a set of parameters to a model, based of the slope of the likelihood of the data of model at the null point.
Stepwise regression. Used to decide which of a set of explanatory variables best describes the outcome. Also includes step-up and step-down regression where variables are progressively added or subtracted from the model
Time series regression. Regression in which the outcome variable is time dependent
Type I, type II errors and Power
•A type I error occurs when the null hypothesis is rejected when it is true. A type I error rate is the expected probability of making a type I error,and this should be decided before collecting data. It is essentially the expected false positive rate of the test and is often denoted by α.
•To understand a type II error rate we need to understand the concept of an alternative hypothesis. For a clinical trial this is the amount we would expect to see if the treatment worked, or the amount that would be 'clinically significant' (or the amount by which we would be persuaded to change treatments). For an epidemiological study it is the change in (say) relative risk for someone exposed to a hazard.
•A type two error occurs when a study fails to reject a null hypothesis when it is false, i.e. the alterative hypothesis is true. A type two error rate is essentially a false negative rate, and is often denoted by β.
Wald test. A measure of the fit of a parameter of a model based on the estimate of the parameter divided by its estimated standard error.
Weibull distribution A parametric distribution for survival data.
1Derived from Campbell MJ 'Statistics at Square Two, 2nd ed ' Oxford :Blackwell Publications 2006
© MJ Campbell 2006