
The p-value itself gives no direct indication of how large or clinically important the estimated effect size is; it does not even tell you which treatment produced better outcomes in the trial. For this reason, confidence intervals are often preferred.
Exercise
How many possible outcomes are there from rolling a single dice? What is the probability of each of these outcomes? Plot each possible score against the probability that it occurs.
How many possible outcomes are there from rolling two dice? What is the probability of each of these outcomes? The easiest way to do this is to draw up a 6x6 table and fill in the total scores in each cell, and then count up how often they occur. Plot these probabilities on the same plot you created for rolling one dice, dividing the total score by two to get the average score per dice.
How many possible outcomes are there from rolling three dice? What is the probability of each of these outcomes? You can draw up 6 versions of the tables above and fill in the total scores including the third dice, or you might prefer to list all the combinations that add up to each of the possible scores from 3 to 18 and count how many there are. Plot these probabilities on the same plot you created for rolling one and two dice, dividing the total score by three to get the average score per dice.
When you are finished, have a look below for some thoughts on this exercise...
With one dice, there are just 6 possible outcomes and each has an equal probability of 1 in 6, or 0.167.
With two dice, there are now 36 possible outcomes, and some are more likely than others. The table makes it easy to spot, and calculate, the distribution.
| 1 |
2 |
3 |
4 |
5 |
6 |
|
| 1 | 2 | 3 | 4 | 5 | 6 | 7 |
| 2 | 3 | 4 | 5 | 6 | 7 | 8 |
| 3 | 4 | 5 | 6 | 7 | 8 | 9 |
| 4 | 5 | 6 | 7 | 8 | 9 | 10 |
| 5 | 6 | 7 | 8 | 9 | 10 | 11 |
| 6 | 7 | 8 | 9 | 10 | 11 | 12 |
With three dice, the pattern becomes more complex. Congratulations if you stuck with the calculations!
Here's what your plot might look like. Strictly speaking, it should be drawn as a bar-chart as this is the correct plot to use for this sort of data, but a line graph is more useful for the purpose of this exercise, which is to see what happens to the distribution of the mean score as we increase the sample size.
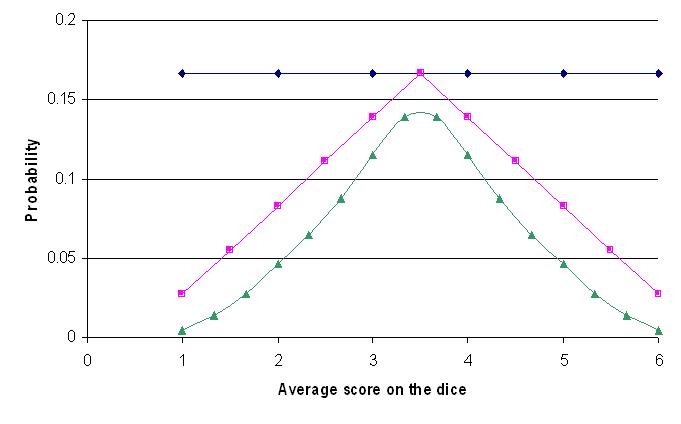
As we increase the number of dice, the distribution of results gets more and more centralised, eventually taking on a curved shape as the results at the extreme become less likely and results close to the known average score (3.5) become more common.
There are 216 possible outcomes of rolling three dice. There is only one way of rolling a score of 3 (average = 1), with a probability of 1/216 = 0.005 and only one way of scoring 18 (average = 6), again with a probability of 0.005. We are therefore approximately 99% confident that when we roll three dice, the average score will be greater than 1 and smaller than 6, because the total probability of rolling a score more extreme than this is 0.005 + 0.005 = 0.01.
There are just 3 ways of rolling a total of 4 (average = 1.33), and 3 ways of rolling 17 (average = 5.67). In total then, there are 1+3+3+1 = 8 ways of rolling an average score of <1.67 or >5.33, a probability of 8/216 = 0.96 or 96%. So, we can be 96% confident when rolling three dice that our average score per dice will lie between 1.67 and 5.33.
When the sample size is large enough (at least 20), the distribution of mean scores will be approximately normal, and we can use our knowledge of the normal distribution and the standard deviation of the sample to approximate the predicted outcomes. This is known as the Central Limit Theorem, and it is why we can use the normal distribution to predict the distribution of mean scores even when the characteristic is not normally distributed within the population itself.
Of course, when we're doing a trial we aren't rolling dice with a known probability of each outcome (or we wouldn't need to do the trial). But, if we know that 95% of our results will lie within 2 standard errors (or more precisely, 1.96 standard errors) of the true mean, then we also know that 95% of the time the true mean will lie within 2 standard errors of our result.
This is what a 95% confidence interval is. The range of values within 2 standard errors of the mean, a range which we are 95% confident contains the true underlying value. A 99% confidence interval is the range within 3 standard errors of the mean.
When the characteristic itself is normally distributed, the t distribution will be more accurate, especially for small samples, and confidence intervals can be calculated using the critical points of the t distribution rather than the normal distribution.
Confidence intervals are usually calculated using the same or very similar methods to those used to calculate the p-value. If one end of a confidence interval is exactly no difference (for example, 0.0 if the statistic is difference between means, or 1.0 if it is the relative risk), then the p-value will (usually) be exactly 0.05. If the confidence interval excludes the value of no difference then p will be <0.05. Confidence intervals therefore give us a simple test of statistical significance whilst also giving us a range of plausible values for the treatment effect. This assists us a great deal in assessing the clinical importance of the result, which is the topic of the next section of this tutorial.
Click the "up" link below to return to the index of the Statistical Significance section, or click here to move on to Clinical Significance...