
Introduction
 Learning objectives: You will learn about how populations change over time, and why there are differences in mortality between countries. This section also looks at the indicators demonstrating international differences and life expectancy variations. Finally, it considers international differences in population age structure.
Read the resource text now.
Resource text
Understanding populations over time
Figure 1: The diagram shows the stages of the demographic transition.

The theory of the demographic transition is that countries move through the stages over time as they become more developed.
Whilst births, deaths and migrations form important building blocks for understanding populations, Omran [1], in his theory of epidemiologic transition, describes many other factors impacting on population change. His theory focuses on the complex changes in patterns of health and disease, and the importance of socioeconomic, political and cultural determinants such as standards of living, hygiene and nutrition. Omran describes the decline of infectious diseases in western Europe, the improvement in health outcomes for women and infants, and improved life expectancy, as well as the gradual increase in cancer and cardiovascular diseases. Japan fits into the 'Accelerated Epidemiologic Transition Model', while developing countries fit into the 'Delayed Epidemiologic Transition Model'.
Thirty years since his theory was first published, many regions are not fitting neatly into Omran's theory. Many low and middle income countries are suffering the double burden of high mortality from infectious diseases as well as emerging epidemics of non-communicable diseases, particularly in urban areas. Russia is experiencing extremely high levels of alcohol related mortality amongst working age men. The increase in childhood obesity in the UK has led to the danger of children having, for the first time, a shorter life expectancy than their parents.
International differences in mortality
To understand the impact of mortality on a population, both numerator, i.e. the number of deaths, and the denominator, the number of people in the population of interest, are needed.
Registration of cause of death only exists in approximately 70 countries, so comparing death rates across countries needs to be done with caution. In India and China, sentinel surveillance systems cover some parts of the population. In other developing and middle income countries, registration systems are poorly developed, and surveys are used.
The Global Burden of Disease Study [2] undertook an extensive synthesis of all available data to give a worldwide set of mortality estimates by age, sex, region and cause. By 2003, data on deaths were available from 115 out of 192 countries, although data were complete in only 64 countries. Coverage was less than 10% in some African countries, and estimates were made for these countries using South African data. For many countries, we still do not have information on who dies from what.
 Death certificates provide space for multiple causes. Summary statistics, reporting a single cause, aim to identify the 'underlying cause of death'. There are, however, a number of weaknesses, for example:
- even in western European countries, diagnosis can be inexact and open to disagreements.
- it is hard to gauge trends in death rates over time as ICD versions change - although in an attempt to reduce this problem, bridging tables are produced (where deaths are dual coded with each of the ICD versions).
International differences on a range of indicators
The 2002 World Health Report examined a range of risks to health. It found that among men, the total burden of disease in the European region for the year 2000 is largely attributable to the consumption of alcohol and tobacco. Alcohol and tobacco consumption accounted for almost as many DALYS as the total disease burden of some regions such as central and south-eastern Europe. This is equivalent to 80% of the total disease burden in western Europe. Download the database to compare countries' mortality, morbidity, lifestyle and health care indicators.
International differences in life expectancy [3]
Figure 2 gives comparative Health Adjusted Life Expectancy (HALE) at birth for selected countries. Stark inequalities are evident. While Japan had the highest HALE, with an average of 75 years, Sierra Leone had an average HALE of just 28.55 years. In general, HALE figures are highest in countries in the northern hemisphere and lowest in war-torn countries of sub-Saharan Africa. Within all of these countries, there are also internal disparities between rich and poor.
Figure 2: Healthy Life Expectancy at birth in selected countries, male and female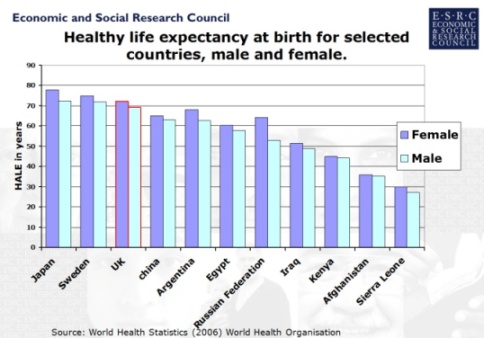
International differences in life expectancy over time [3]
Global life expectancy improved significantly during the Twentieth Century, especially in developed countries. Life expectancy at birth in the UK was 47 years in 1901 [5]. At the end of the century it was 77.5 years, an increase of over 64 per cent [3]. These gains were due largely to the eradication and control of numerous infectious diseases and to advances in agricultural technologies such as chemical fertilisers. These increases, however, have not been universal. Due to the effects of HIV/AIDS, life expectancy has declined recently in many sub-Saharan African countries. Average life expectancy in sub-Saharan Africa is now 47 years, when estimates suggest it could have been 62 without AIDS [4]. Similarly, since the break-up of the Soviet Union in 1989, male life expectancy in Russia has dropped by 6 years to from 65 years in 1989 to 59 in 2005.
International differences in population age structure [4]
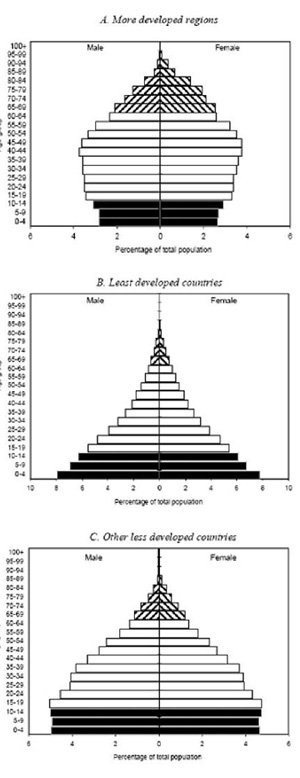
The diagram below shows three population pyramids which demonstrate how the age structure of different populations varies according to how developed they are. The top pyramid represents developed countries, the middle pyramid represents least developed countries, and the bottom pyramid represents less developed countries that are becoming more developed.
Figure 3: An example of population pyramids.
Regional differences in respect of age
For example, the population of Northern Ireland is younger than the UK average
Regional differences in ethnicity
For indications of public health in the English regions see ethnicity and health.
Regional differences in social class
For widening inequalities in obesity by social class see health profile of England.
Office of Population Censuses and Surveys (OPCS) longitudinal study identified a 1% sample of the 1971 Census to be followed until their death. The cohort is added to at each subsequent census by people who were born on one of the 4 selected dates used to define the cohort (new recruits are either new births or migrants). This study confirmed the existence of inequalities in health and the importance of social determinants such as housing tenure.
The Whitehall cohort study of British civil servants found marked inequalities in health and mortality by employment grade.
Regional differences in life expectancy
Whilst life expectancy is increasing overall in England, there is a distinct 'north/south' divide for female life expectancy at birth. In all regions from the Midlands northwards, female life expectancy is significantly shorter than in the regions to the south. The difference is around one year of life. For men in the north, life expectancy at birth is around two years shorter than for men in the south[5].
Differences exist within regions also - see slide 20 showing tube map and differences in life expectancy in London.
Related links
-
[1] Omran, AR The Epidemiologic Transition: A Theory of the Epidemiology of Population Change. Milbank Memorial Fund Quarterly 49 (Oct 1971): 509-538
[2] World Health Organisation: Health statistics and health information systems.
[3] ESRC Society Today: Global Health Inequalities.
[4] United Nations Department of Economic and Social Affairs/Population Division 23 World Population Prospects: The 2004 Revision, Volume III: Analytical Report.
[5] Health profile of England, Department of Health, 2006.